I have put a lot of hours into building up a continuous delivery environment which I can be proud of. I already wrote in my previous blog about how to setup a Jenkins for this purpose. It was a ground work where we start building in this blog post. This blog post is about how to do continuous Delivery with Episerver Digital Experiance Cloud Service but nothing stops you to use this information in some other place.
Continuous delivery (CD) and continuous integration (CI)
For sure there are better references about CI and CD than following will be. Actually, if you have hard time in convincing your product owner to continuous delivery we have a blog for that purpose as well. For me continuous integration means merging work in git repository hourly with coworkers working on the same things. On the other hand continuous delivery means pushing the work to the customer as fast as we can. Developers work on the codebase and then deploy it once they are confident with it. When you speed up the cycle of your deployments, your customer will have new features faster, and you they can steer the direction of your development in a truly agile way. Characteristics of CI and CD are below.
Continuous integration:
- Integrate early and often
- Make the code available to other developers
- Make sure the code builds after merging to the works of other people
- Track the quality of your code
- Test your code
Continuous delivery:
- Push changes to production early and often
- Make the code available to your end-users
- Make sure that you can deploy at any time
- Track the quality of your runtime
- Test your deployments with automated release process
I feel that continuous integration is something that software business is doing already with high adaptation rate. Continuous delivery in the other hand is something that many are still learning. Continuous delivery definitely needs more maturity from the development team since you need to automate a lot of things to be able to deploy automatically. You will need a process that makes all kind of sanity checks across the line to trust the deployments on the hand of the automated system. The good thing is once you get on the road it will be a lot easier to adjust the process when you have ability to repeat it multiple times a day.
The hardest question asked about continuous delivery is often: “How can your customer decide when a feature is good enough for release?”. This is something that you need to decide per feature. With Episerver creating new content features is easy. Customer tests the new content types and decides when they serve them well enough to be published. Changing existing content can be done with feature toggles. Of course creating a feature toggle is a change too and can be misimplemented. From this emerges the need for automatic testing. You need to catch errors before they get on the production. The hardest kind of changes are cross-cutting concerns like authentication or database schema changes. You need to be super careful in how do you implement and roll these kind of features to the production. In the end the most important thing is that your development organization (developers and business people) have the correct working habits and the mindset for failing fast and failing often. Some day you will fail and with CD you will be most likely to recover faster.
Having said scary things about deploying features there is the positive side of the coin. When you deploy often you have only a small changeset at the time. It is a lot easier to find the problems on your patch and fix them. Installing the fix is also easy when you have process to take care of all and when manual work is not involved.
the DXC Service
In case you don’t know what the DXC Service is I will describe it briefly. The DXC Service is a managed platform from Episerver to host Episerver CMS in the Azure cloud. Instead of working directly with the Azure platform you will get the services the Episerver thinks that you need. In case that you wish to have more services. Well tough luck. You will need to setup an additional Azure subscription because you won’t be adding them to the DXC Service subscription. Actually you won’t be able to see your production stuff in Azure portal at all. The DXC Service comes with three environments: integration, preproduction and production. The architecture of the DXC service is as following:
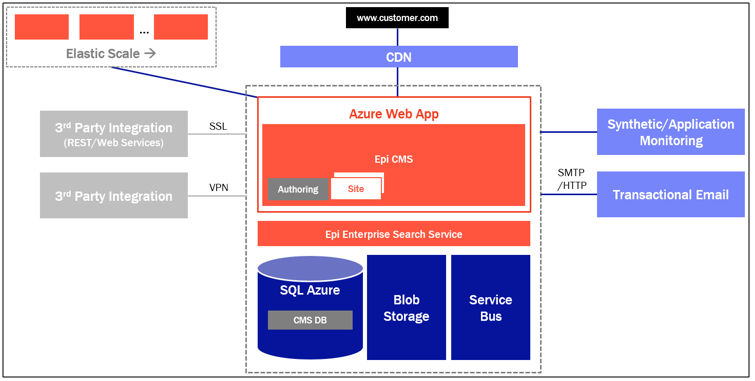
The architecture picture was taken directly from their service description. What I would like to highlight here is that they have CDN, they are using Azure Web apps, Azure Storage, Azure Service Bus, Azure SQL and a smtp service. This is a pretty recommended setup when building web applications to Azure.
The DXC Service architecture is actually pretty nice as it is. If you are building up simple CMS solution you won’t be needing much else to be honest. In case you are building extranet, intranet or commerce site then you might end up in a different situation. The main problem is that you won’t be able to add services like Azure Functions, Azure AD, Azure B2C AD or even use the full potential of underlying infrastructure since WebJobs are not supported. You will also have limited visibility on the services you have like Azure Service Bus, Azure Storage and Azure SQL. Episerver does not provide you the technological details about the services you are running but you can of course implement functionality to your production site that tells you how they have been configured (of course there will be security issues with this). Things that you will do with this information is of course in the danger zone. I have been doublechecking what I can do and what I can’t do constantly from Episerver. If you are going to implement a complex project on top of the Episerver DXC Service then you should plan on having an Azure Subscription for deploying all the additional services you might need.
You might be able to read between the lines that I’m not perfectly happy about lost control on the Azure services in the DXC Service. Another thing I’m not perfectly satisfied about is the deployment process. Episerver has decided to reinvent the wheel and implement their own deployment pipeline for the DXC Service. You can do deployments with WebDeploy only to integration environment. From that point onwards you will need to use either their own portal or make service requests (via phone or email) to get deployment into preproduction and finally you need a service request to get the software into the production. Effectively this means that you will have hard times to control the exact moment of a deployment for preproduction and production via continuous delivery. To preproduction environment you will be able to do manual deployments via their own portal and they have been promising to open that for production too. Unfortunately there is no API for that or no supported devops way whatsoever. This means that you either fall back to emailing them or make some serious browser scripting to bypass these problems. We went to the email way because I think that it pushes Episerver towards finding the right solutions for this problem. The problem with email deployment is 24h SLA for registering a ticket (Episerver does not do this automatically) and 24h SLA for fulfilling request which sums up to total of 48h to get the deployment done once email is sent. Which effectively would mean that we need to ask the deployment 48h before if we want it to take place at the exact moment of time. Here is the The Episerver DXC Service description vision about the deployments.
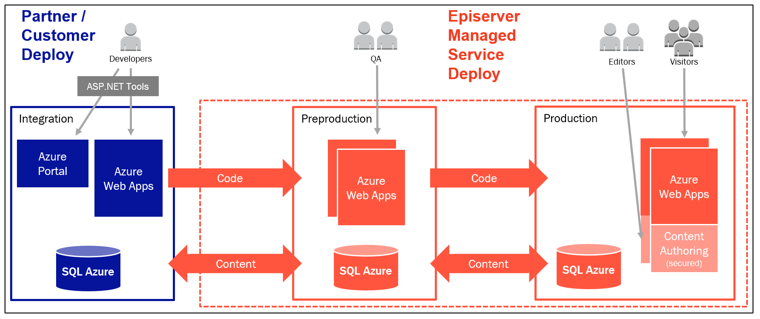
I guess the noteworthy thing is that code swims towards production and content swims towards development. Content arrow towards production means once only in the case of the first deployment. This means that you can replenish your integration and preproduction environment data with the production data. If you wish to do so you need to implement your solution so that you can recover integration and preproduction sites to the correct site settings etc. Episerver won’t do that for you. One another thing to notice is all the stored data from the Episerver Forms and other personal data storages. I would highly encourage to delete completely or scramble that data on the replenish process.
Our team and the process
We are working on a project that has multiple CMS sites on the same DXC Service platform. It is not a simple project and our developer team is somewhat big for an Episerver project. Currently we have seven developers working on the project most of them being full-time and few doing split with some other project. This means that in a busy day there will be a lot of stuff going on on our Git repository. Our working habits wary on the problem at hand. If we are doing straightward and simple things just do it and push it. If we are doing tricky things then creating a branch and having other developer reviewing your work is advised. That is enough background information. Now we should focus on the process that starts on the git push to the master branch. Here is an overall picture of our Jenkins build pipeline.
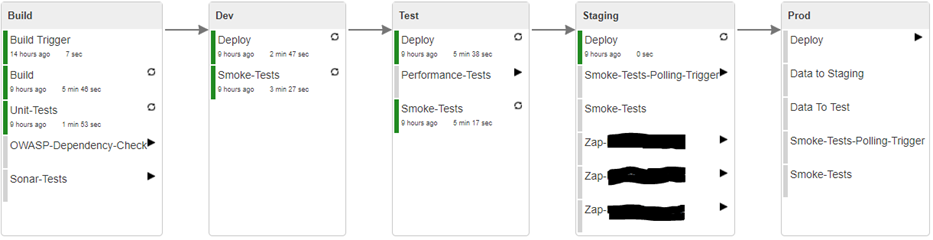
Jenkins build pipeline has been separated to few stages that somehow represents where things are happening. For most of the stuff those are self-explanatatory but there are few scheduled tasks that are more or less just thrown somewhere. These are long-running or heavy tasks that needs time more than we are willing to give for each deployment. For example ZAP scans can take hours and we want to publish fast and often. So instead of scanning every build we are doing daily scanning. Here is few explanations what is happening.
Build phase
- Build trigger task is triggered by git commit
- Build tasks builds the software and makes a release to Octopus Deploy
- Unit-tests are run after the build and making the release
- OWASP-Dependenchy-Check scans nightly if we have any known vulnerabilities in our binaries
- Sonar-Tests makes nightly a static code analysis of our current codebase
Dev phase
- Deploy makes a deployment with Octopus deploy to our internal test server once unit tests are passed
- Smoke-tests are run to see if the site is fine
Test phase
- Deploy makes a deployment with Octopus deploy to the DXC Service integration environment once the Dev smoke-tests have passed
- Smoke-tests are ran to see if the site is fine
- Performance-Tests are run nightly to track on the performance of the website
Staging phase
- Deploy sends an email to the Episerver support for an deployment once the Test smoke-tests have passed
- Smoke-Tests-Polling-Trigger constantly polls if the version of the site has changed
- Smoke-tests are ran whenever polling trigger notices a change in the version of the site
- ZAP-scans are run nightly to see if there are any low-hanging security enhancements to be made
Prod phase
- Deploy sends an email to the Episerver support for an deployment once per day or in demand
- Smoke-Tests-Polling-Trigger constantly polls if the version of the site has changed
- Smoke-tests are ran whenever polling trigger notices a change in the version of the site
- Data to staging and data to test sends an email to the Episerver support to refresh data of integration and preproduction environment weekly
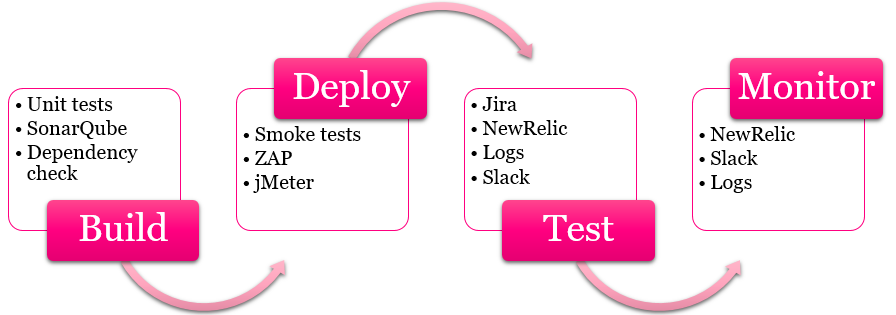
So from quality perspective to get the software into production it has been surely passed unit-tests and smoke-tests. In addition we have SonarQube, OWASP Dependency Check, OWASP ZAP and jMeter gathering information that needs to be digested. On top of that we of course follow what is happening in the Episerver and in the .NET versions. Here is some kind of picture about different kind of information sources that we are leveraging when building towards top quality.
Building the build pipeline
After the long introductionary presentation of deployment philosophy we finally get the point were I can show some code. We are using the Jenkins Job DSL plugin in building our build pipeline. This means that we have a second repository for infrastructure where we have a groovy script for the Jenkins pipeline. Then we have one job in the Jenkins that builds up the other Jenkins jobs with the groovy script. So let’s see how our phases are from that perspective. Starting from easy side this is how the build trigger looks like.
Build trigger
job(applicationName + ' ' + buildEnvironmentName + ' Trigger') {
	deliveryPipelineConfiguration(buildEnvironmentName, "Build Trigger")
	wrappers {
        deliveryPipelineVersion('\$GIT_REVISION', true)
    }
	scm {
        git {
            remote {
                url(gitRepository)
				credentials(gitCredentialsId)
            }
            branch(branchName)
        }
    }
	triggers {
        scm('* * * * *')
    }
	quietPeriod(5)
	publishers {
		downstream(applicationName + ' ' + buildEnvironmentName, 'SUCCESS')
    }
}
So the job has cron scheduler that constantly polls if there are changes on the git repository and triggers a downstream job if there are. There are a lot of variables used to make it easier to change the naming practices of the whole pipeline. From this point onward I will present only parts of the job DSL to reduce the amount of noise.
Build and octopus release
configure { proj ->
	def builders = proj / builders
	builders << 'hudson.plugins.msbuild.MsBuildBuilder' {
			msBuildName(msBuildInstallationName)
			msBuildFile(buildFile)
			cmdLineArgs('/t:Build /p:RunOctoPack=true /p:OctoPackPackageVersion=1.0.${BUILD_NUMBER} /p:OctoPackPublishPackageToHttp='+oServerUrl+'nuget/packages /p:CmdLineInMemoryStorage=true /p:Configuration=Release /p:OctoPackPublishApiKey=${OCTOPUS_API_KEY} /p:DeployOnBuild=false')
			buildVariablesAsProperties('false')
	}
	def pubs = proj / publishers
	pubs << 'hudson.plugins.octopusdeploy.OctopusDeployReleaseRecorder' {
		serverId(oServerId)
		project(oProject)
		environment('')
		tenant('')
		waitForDeployment('false')
		releaseVersion('1.0.\${BUILD_NUMBER}')
		releaseNotes('true')
		releaseNotesSource('scm')
		channel(oChannel)
		releaseNotesJenkinsLinkback('true')
		deployThisRelease('false')
		packageConfigs {
			'hudson.plugins.octopusdeploy.PackageConfiguration' {
				packageName(oPackage)
				packageVersion('1.0.\${BUILD_NUMBER}')
			}
		}
		defaultPackageVersion('1.0.\${BUILD_NUMBER}')
	}
}
In case you wondered why I made release before running unit tests. The answer is that I like to have unit-tests and build separated in the pipeline. Still I want to be able to easily track octopus deploy build version in Jenkins and the easiest way is to use build number as a version number. This way every build will have a unique number and I can find out which Octopus release is which Jenkins build. In addition to all this at this point we will do few funny things. We package the git commit hash and the build number into the folder structure and archive the application. Archiving means that later on other Jenkins jobs can access this job from downstream and use the same binaries.
steps {
	powerShell('\$path = "'+buildVersionPath+'"'+
		System.getProperty("line.separator")+
		'If(!(test-path \$path)){ New-Item -ItemType Directory -Force -Path \$path }'+
		System.getProperty("line.separator")+
		'git rev-parse --verify HEAD | Set-Content "\$path/ver.txt"'+
		System.getProperty("line.separator")+
		'\$env:BUILD_NUMBER | Set-Content "\$path/rel.txt"')
}
We use the groovy script to generate a PowerShell script that is able to parse the information that we need and put it on to the folder structure. Finally we archive the whole thing.
publishers {
		archiveArtifacts {
			pattern("**/*")
			exclude("**/.git/**,**/static/node_modules/**,**/static/src/**,**/static/styleguide/**")
			onlyIfSuccessful()
		}
	}
There some excludes added to archiving for getting better IO out of the build server. Without those excludes every build step that uses this archive seemed to last 20-30 minutes longer since we have a lot of node modules and our repository is becoming a rather large one.
Unit tests
steps {
	copyArtifacts(applicationName + ' Build') {
		buildSelector {
			upstreamBuild {
				allowUpstreamDependencies(false)
				fallbackToLastSuccessful(true)
			}
		}
		includePatterns('**/*')
	}
}
configure { project ->
	def mstest = project / builders / 'org.jenkinsci.plugins.MsTestBuilder' {
		msTestName(msTestVersion)
		testFiles(applicationPrefix+testDllPostFix+'\\bin\\Release\\'+applicationPrefix+testDllPostFix+'.dll')
		resultFile(testFile)
		continueOnFail('false')
		categories('')
		cmdLineArgs('')
	}
	def mstestPublish = project / publishers / 'hudson.plugins.mstest.MSTestPublisher' {
		testResultsFile(testFile)
	}
}
Running unit tests is not especially interesting. First we copy the archived information from the upstream job. Then we just run the tests and make sure that there alerts about failure. We have found having chatbots the most convenient solution for the team.
Deployment with Octopus Deploy
steps {
	powerShell('$ErrorActionPreference = "Stop"'+
		System.getProperty("line.separator")+
		'\$path = "'+buildVerPath+'"'+
		System.getProperty("line.separator")+
		'\$releaseNumber = Get-Content "\$path/rel.txt"'+
		System.getProperty("line.separator")+
		'octo deploy-release --project '+oProject+' --channel '+oChannel+' --releaseNumber 1.0.\$releaseNumber --deployto '+oEnvironment+' --server '+oServerUrl+' --progress --waitfordeployment --apiKey \$Env:OCTOPUS_API_KEY')
}
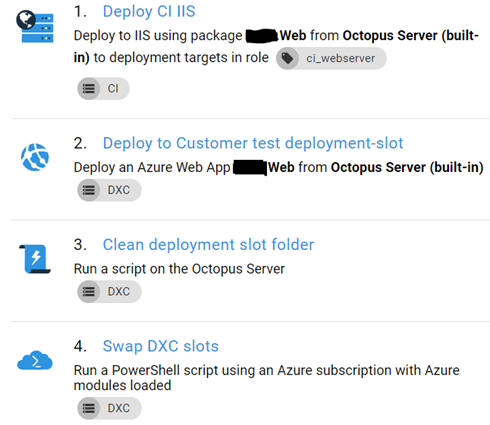
From the Jenkins perspective the deployment process is quite easy. Just make a call for octo.exe. Of course you need to setup your deployment processes into the Octopus Deploy. For us they are rather simple. For our internal testing environment (we are calling it CI) we use octopus deploy agent and do just some configuration transformation beside normal WebDeploy. For the DXC Service integration environment we deploy to a deployment slot. Clean up few files and finally swap slots. The files we need to clean up are the configuration transformation files for the CI and postdeploy scripts. They are not cleaned up automatically with the Azure Web App as they are with the on-premise IIS server.
The nice thing our setup is the build promotion. Even though we are rebuilding software for unit-tests and smoke-tests we are building only once for deployments. Binary compilation and configuration are separated from each other which means that we can trust that our binaries are the same in each environment and they won’t change because of time relative issues like some 3rd party dependency not being fetched or somebody patching server. Even when we are doing deployments from the Jenkins we can still see and do build promotions from the Octopus Deploy too.
Smoke testing
Smoke testing is done with the same kind of DSL as the unit testing as we are using unit tests for smoke testing too. We just have two separated projects in our solution for different kind of tests. Smoke tests are tests that needs something to be deployed before we can test. We have few basic tests that we do.
- Urls in the sitemap returns 200
- Different archetypes of pages render with JS ok
- Robots.txt is found
We could see that all the pages would render with JS but it would take a really long time. The only point where smoke testing differs from the unit tests is that since Episerver does not always startup so fast we have a wait routine for waiting the server to respond with reasonable http statuscodes after full startup.
def ls = System.getProperty("line.separator")
steps {
	powerShell('\$request = [system.Net.WebRequest]::Create("'+targetAddress+'")'+ls+
		'$result = ""'+ls+
		'for (\$i = 1; \$i -le 100; \$i++) {'+ls+
		'  try {'+ls+
		'    \$result = \$request.GetResponse()'+ls+
		'    if (\$result -is "System.Net.HttpWebResponse" -and \$result.StatusCode -ne "") {'+ls+
		'      break'+ls+
		'    }'+ls+
		'  } catch [System.Net.WebException] {'+ls+
		'    \$result = \$_.Exception.Response '+ls+
		'  }'+ls+
		'  Start-Sleep -s 2'+ls+
		'}'+ls+
		'Write-Host "Status was: \$(\$result.StatusCode)"')
}
Email deployments
def emailSubject = 'Pre-production deployment \$PIPELINE_VERSION'
def emailContent = 'Schedule: ASAP'+
	'\nPriority: Medium'+
	'\nPipeline revision: \$PIPELINE_VERSION'+
	'\nFrom: Integration'+
	'\nTo: Pre-production'+
	'\nDeploy: '+
	'\n\tCode: Yes'+
	'\n\tDatabase: No'+
	'\n\tBlobs: No'+
	'\n\tDeployment verification url:'+
	'\n\t\thttps://www.google.fi?q=figure+out'+
	'\n\nBest Regards: Jenkins'
publishers {
	extendedEmail {
		recipientList(emailRecipientList)
		replyToList(emailReplyTo)
		defaultSubject(emailSubject)
		defaultContent(emailContent)
		contentType('text/plain')
		preSendScript('$DEFAULT_PRESEND_SCRIPT\nmsg.addHeader("X-Priority", "1 (Highest)");\nmsg.addHeader("Importance", "High");\nmsg.setFrom(new javax.mail.internet.InternetAddress("'+emailSender+'"))')
		triggers {
			beforeBuild()
		}
	}
}
This is pretty close that we got into. We use some Java inside groovy script to setup email being sent as a high priority and to rewrite the sender to be something that we actually want to get responses to. We also have a verification url packaged into emails that we wish the Episerver Support to use to see if the software is fine and rollback if the page does not render correctly. We have same kind of emails for the data replenish too. Instead code we just say deploy data.
Triggering smoke tests
def persistentHash = './persistenthash.txt'
def tempHash = './temphash.txt'
def testFile = './test_if_this_exists.txt'

steps {
	powerShell('if(!(test-path "'+persistentHash+'")) { "init_first_non_existent_hash" | Set-Content "'+persistentHash+'" }'+
		System.getProperty("line.separator")+
		'rm -force "'+testFile+'" -ErrorAction SilentlyContinue'+
		System.getProperty("line.separator")+
		'rm -force "'+tempHash+'" -ErrorAction SilentlyContinue'+
		System.getProperty("line.separator")+
		'curl https://www.google.fi?q=ver.txt -UseBasicParsing | % { $_.Content | Set-Content "'+tempHash+'" }'+
		System.getProperty("line.separator")+
		'if((Get-FileHash "'+persistentHash+'").hash -ne (Get-FileHash "'+tempHash+'").hash) { "true" | Set-Content "'+testFile+'" }'
		)
	conditionalSteps {
		condition {
			fileExists(testFile, BaseDir.WORKSPACE)
		}
		runner('DontRun')
		steps {
			powerShell('curl https://www.google.fi?q=ver.txt -UseBasicParsing | % { $_.Content | Set-Content "'+persistentHash+'" }')
			downstreamParameterized {
				trigger(applicationName + ' ' + stagingEnvironmentName + ' Smoke-Tests')
			}
		}
	}
}
The idea of this PowerShell script is to store a commit hash into our jobs working folder. Then see on every 5 minutes if the hash we have is matching with the one that is on the production server (yeah, I replaced the actual url with google urls). If it does match then nothing happens. If it does not then we create a temporary file. Then we have a conditional step that from Jenkins which checks if the temporary file is present or not. If there is a file it updates the hash in working folder and triggers smoke tests for corresponding environment. This way our smoke tests start running within 5 minutes after the Episerver support has done the deployment.
The nightly stuff
Here is how I run the OWASP ZAP from Jenkins via PowerShell. I use my own PowerShell modules for managing ZAP. There are Jenkins plugins too but I had my own version before they existed so I’m kind of stuck on my own baby. I tried the plugin but it just didn’t do the same thing so I left it and went back to my own scripts.
def lineSeparator = System.getProperty("line.separator")
def zapReport = '(\$env:WORKSPACE+"\\'+zapReportFile+'")'
parentJob.steps {
	powerShell('Import-Module C:\\tools\\powershell-zap-master\\PowerShell-ZAP\\PowerShell-ZAP.psm1'+lineSeparator+
		'Set-ZapLocation "C:\\Program Files\\OWASP\\Zed Attack Proxy\\"'+lineSeparator+
		'Set-ZapReportLocation '+zapReport+lineSeparator+
		'Set-ZapUrlToScan "'+zapUrlToScan+'"'+lineSeparator+
		'# Ensure that daemon is running'+lineSeparator+
		'Start-Zap'+lineSeparator+
		'# Configure policies, this just enables all scanners atm'+lineSeparator+
		'Set-ZapScanPolicies'+lineSeparator+
		'# Do spidering against the url'+lineSeparator+
		'Invoke-ZapSpidering '+lineSeparator+
		'# Do ajax spidering against the url'+lineSeparator+
		'Invoke-ZapAjaxSpidering'+lineSeparator+
		'# Do scanning against the url'+lineSeparator+
		'Invoke-ZapScanning'+lineSeparator+
		'# Save report'+lineSeparator+
		'Save-ZapReport'+lineSeparator+
		'# Destroy scans'+lineSeparator+
		'Remove-ZapCurrentSpider'+lineSeparator+
		'Remove-ZapCurrentScan')
}
parentJob.publishers {
	archiveJunit(zapReportFile) {
		allowEmptyResults()
		retainLongStdout()
		testDataPublishers {
			publishTestStabilityData()
		}
	}
}
For performance monitoring we use my coworkers jmeter-perfotrator which is just a template for jMeter. From the Jenkins the usage is quite simple.
steps {
	 batchFile('call '+jmeterPath+' -n -t "%WORKSPACE%\\Solution Items\\jmeter\\TestUrls.jmx" -j "%WORKSPACE%\\log.txt"')
}
configure { project ->
		def perfPublish = project / builders / 'hudson.plugins.performance.PerformancePublisher'
		(perfPublish / 'parsers' / 'hudson.plugins.performance.JMeterParser' / 'glob').value = 'results\\results.jtl'
}
For the dependency checks we use a plugin. In addition you need to setup a job to update the dependency data. After you have the fresh dependency data then you can run the check with DSL like this:
configure { project ->
	def owaspCheck = project / builders / 'org.jenkinsci.plugins.DependencyCheck.DependencyCheckBuilder' {
		skipOnScmChange(false)
		skipOnUpstreamChange(false)
		scanpath("")
		outdir("")
		datadir("C:\\OWASP_DEPENDENCY_DATA")
		suppressionFile("")
		isAutoupdateDisabled(true)
		includeHtmlReports(true)
	}
	def owaspPublish = project / publishers / 'org.jenkinsci.plugins.DependencyCheck.DependencyCheckPublisher' {
		healthy("")
		unHealthy("")
		thresholdLimit("low")
		pluginName("[DependencyCheck] ")
		defaultEncoding("")
		canRunOnFailed("")
		usePreviousBuildAsReference("true")
		useStableBuildAsReference("false")
		useDeltaValues("true")
		shouldDetectModules("true")
		dontComputeNew("true")
		doNotResolveRelativePaths("false")
		pattern("")
	}
}
For the static code analysis we use the SonarQube. It is fairly easy to setup with the Jenkins. Just wrap your build between the SonarQube begin and end analysis.
// Configure begin analysis
configure { project ->
		def sonarBegin = project / builders / 'hudson.plugins.sonar.MsBuildSQRunnerBegin' {
			projectKey(sonarProjectKey)
			projectName(sonarProjectName)
			projectVersion(sonarProjectVersion)
			msBuildScannerInstallationName(sonarScannerName)
		}
}
// ... Your build goes here
// Configure end analysis
configure { project ->
		def sonarEnd = project / builders / 'hudson.plugins.sonar.MsBuildSQRunnerEnd'
}
Show it on the TV
Finally one of the biggest strenghts of this setup is the ability to show it on the screen with relatively simple DSL (and of course with some Jenkins plugins).
deliveryPipelineView(applicationName + ' delivery Pipeline') {
	pipelineInstances(10)
	showAvatars()
    showChangeLog()
	showTotalBuildTime()
    enableManualTriggers(true)
	allowRebuild()
    showAggregatedPipeline(false)
    pipelines() {
        component(applicationName, applicationName + ' ' + buildEnvironmentName + ' Trigger')
    }
}

buildMonitorView(applicationName + ' build Monitor') {
	description(applicationName+' jobs')
	jobs {
        name(applicationName)
		regex('.*'+applicationName+'.*')
	}
}
There are two views. The pipeline view shows the view that was in the beginning of the blog post where you could see different phases of the continuous delivery process. The build monitor view builds up a screen full of rectangles that are green / yellow / red depending on your jobs status.
We are asking the production deployment in the early morning hours so it usually takes place just before we got to the work. It is kind of peaceful time to do deployments and we have few earlybirds that will notice if something strange is going on when they get to work.
Summarizing
Some characteristics about our project:
- More than 100 deployments per month
- Go live every workday morning (~20 times a month)
- Half a year of live site hosting
We have had a few issues but nothing that would have upset our customer badly. Most of the times if there is an issue our smoke-tests notices it earlier than the Episerver Support does even when they are the ones who are deploying it. Usually the problems have been on the configuration transformation that is done by the Episerver Support with a configuration that we are not aware of. Once or twice we have been forced to make a fix patch immediately after going live. On these rare occasions it takes usually less time to implement the patch than to get episerver installing it. They tell us to call them if we have problem but it is really hard to call and solve the problem at the same time. If we call them, then we need double the people to figure out the situation since the telephone consumes one guy.
In the DXC environment the problem remains that after a failed deployment it takes too much time to get the fixing deployment on the way. Immediate rollbacks do help, but not if we need to wait for a hour or two for that to happen. We have a fix ready on that time and then we would rather go forward-only deployment with the fixed version.