Adequate performance is a critical requirement for any project, and one I want to nail before going live. We usually know the expected amount of traffic, but how well do we know the actual site performance? As rule-of-thumb, I expect an Episerver site to handle at least 10 page requests / second per one CPU core. For example, a server with 4 CPU cores should be able to handle more than 144,000 page requests in an hour. As with all assumptions, there should be a way to verify it.
Measuring made simple
The best tool I have found to measure Episerver read-only performance is JMeter, which is an extremely versatile tool, but also abhorrent to configure without prior experience. I am no JMeter expert, yet time and determination yielded something useful I wish to share: JMeter-perfotrator
It is a ready-to-use JMeter project for simple performance testing with the aim to minimize manual work, the only required configurable part being the test URL list. You can download the GitHub repository as a ZIP file for convenience, and it should work right out-of-the box. Java is required, sorry for that.
First, grab some URLs for testing. Add the URLs to file project\urls.txt, one URL per line. Fire up JMeter with start-gui.bat and you should see the JMeter UI. It might look like a control panel out of a Soviet power plant, but the only buttons you need to know for basic use are these.
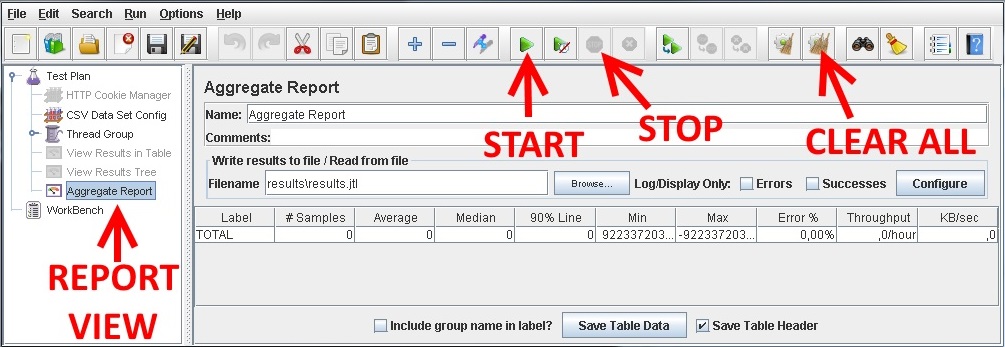
Eager as we are, let us fire up the test by pressing START, and view the results as Aggregate Report. In this test I used Episerver Alloy demo on localhost.
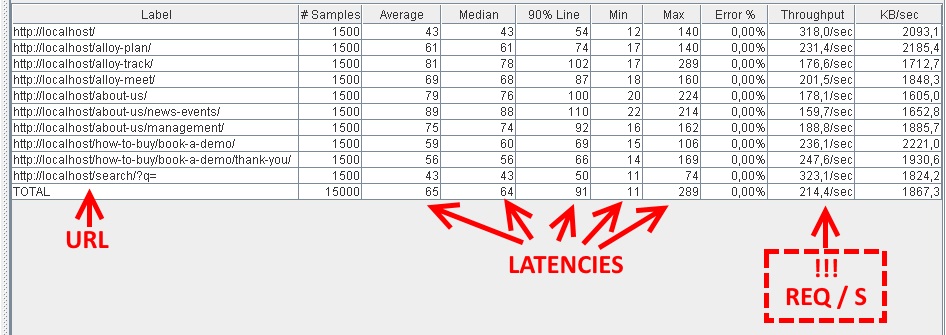
The report is easy to interpret, just ensure that Error % is always zero. The most interesting column is Throughput as its unit is requests per second, the answer we were looking for.
While executing the test, the server CPU usage should be sky-high.
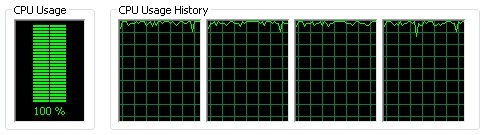
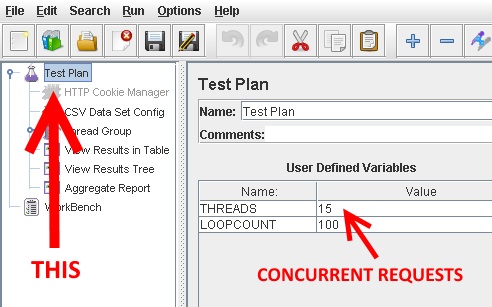
If not, you can change the execution parameters to increase the load. By default, the project uses 15 threads for requests, that is 15 simultaneous requests running at a time. Each thread will execute 100 requests, totalling to 1500 requests per each URL. The defaults are changeable on Test Plan-node.
While we are at it, let us see the other options too.
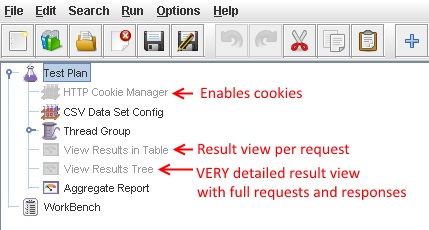
You can enable grayed out nodes by left-clicking and choosing Enable in the context menu.
- Cookie Manager: Enables cookies. Threads will remember and use cookies like a browser. You can also add custom cookies that are used by all threads, for example, a session cookie for authentication.
- View Results in Table: Shows details per request in a table. Not as verbose as View Results in Tree.
- View Results in Tree: Very detailed results per request. It contains HTTP request and response details, thus making this a great help when debugging site access and errors.
Testing static resources
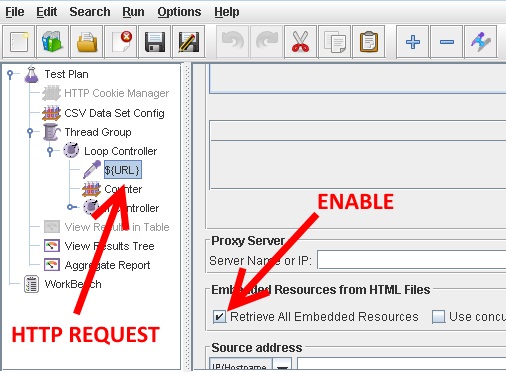
JMeter-perfotrator downloads only the HTML, whereas stylesheets, scripts and other embedded resources are ignored. Static resources do not affect CPU usage much at all, but use a huge amount of bandwidth, which will hinder the testing. Furthermore, static resources are easily cached by browsers and proxies, so I normally do not consider them an issue.
Though if you wish, you can change the setup to download the embedded resources too.
Reliable site setup
The most reliable results are acquired from an environment identical to production. Unfortunately this is not always possible in development stage. If you choose to use localhost, bear in mind that there is virtually no network delay or bandwidth limit, which will yield way too optimistic results. Also, mind that running the site on Visual Studio with IIS Express will have unstable performance compare to real IIS. I have often used CI environment when production or test environments were not available.

Protip: Profiling the code
JMeter may show you the performance rating, but profiling will tell you where the hold-up is. Very useful for spotting performance issues in code, and to help avoiding premature optimization - just optimize what needs to be optimized. JetBrain’ dotTrace is my tool of choice.
Protip: Acquiring the code
Sometimes the interesting parts are in external DLLs, which may not have source code available at all. Luckily, we have decompilers to solve the problem, for example, JetBrain’ dotPeek. With the code in our hands we can look for fixes, workarounds and propose improvements.