Python is the language of choice for many Data Scientists. It has a rich set of packages for different Data Science tasks. Therefore, many Data Scientists were excited when Snowflake announced integrations with Python in their database.
To faciliate integrations to other programming languages Snowflake has created Snowpark. With Snowpark you can create user defined functions and stored procedures to run Python scripts that, for example, train a Machine Learning model and writes the result to the database, without having to move the data out of the database. There are tons of tutorials on how to do this. Today I’d like to focus on another aspect of what we as Data Scientists do. As a Data Scientist I do not spend most of my time building ML-models. Most of my work is centered around doing exploratory analysis, digging into unseen data, making visualizations and sharing these with stakeholders.
In this blogpost I’d like to share with you how we can use the Snowpark DataFrame API together with Quarto to create a dynamic presentation that analyzes the Eurovision song contest, without having to open Microsoft Powerpoint or Google Slides.
On notebooks
Many Data Scientists uses Jupyter Notebook to do data analysis. In a Jupter Notebook you can combine code with plots and text to comment your findings. However, when you want to bring a notebook into the hands of a stakeholder, you rarely want to send a raw notebook. In my case I usually want to put together a report or a presentation. There are ways to do this with Jupyter, but it always feels a bit clumsy.
Enter Quarto
Quarto is an open-source scientific and technical publishing system built on Pandoc. It is very similar to a Jupyter Notebook (and is actually powered by Jupyter) but the output is, in my view, prettier. Because it is based on Pandoc you can render your code into a report, a presentation or even a website. If you are familiar to Rmarkdown Quarto basically works in the same way but is language agnostic.
Development setup for Quarto
For my Python work I mainly use VSCode. One good thing about Quarto is that it has an excellent VSCode plugin. You can follow the instructions here.

Creating a virtual environment for Snowpark
I use conda to create virtual environments for Python. In this case I
have a conda.yml where I list package dependencies. The yaml-file
comes from a Snowflake
tutorial.
conda env create -f conda_env.yml
conda activate pysnowpark
To be able to use the environment in Quarto I need to register it to the jupyter kernel.
python -m ipykernel install --user --name=pysnowpark
Set up the Quarto document
Via the command palette in VSCode you can easily create a new .qmd
document (or .ipynb if you want the Jupyter notebook experience)
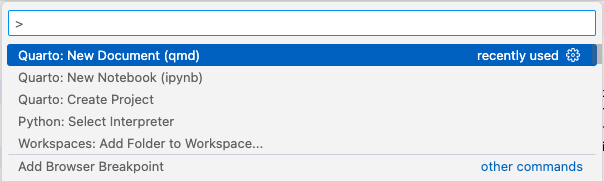
I’m using .qmd. In the header I can now specify my virtual
environment.
---
title: "Reporting with Python and Snowflake in Quarto"
format: html
jupyter: pysnowpark
---
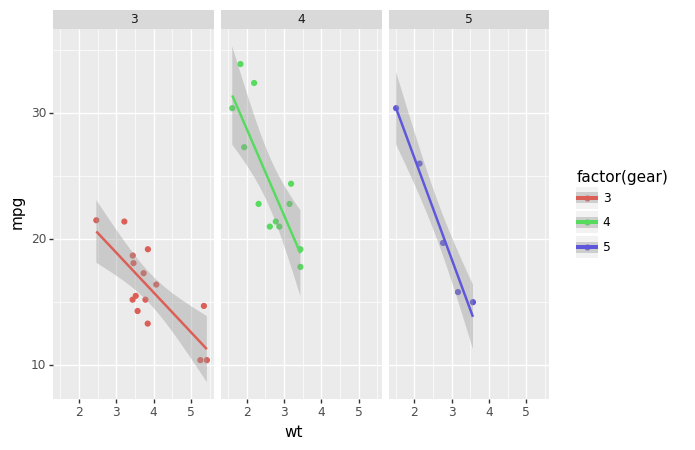
Now you can just add python code chunks to your document. I will be
using plotnine to create plots in our report.
from plotnine import ggplot, geom_point, aes, stat_smooth, facet_wrap
from plotnine.data import mtcars

(ggplot(mtcars, aes('wt', 'mpg', color='factor(gear)'))
 + geom_point()
 + stat_smooth(method='lm')
 + facet_wrap('~gear'))
Connect to Snowflake
I have created a free 30 day trial for Snowflake. To be able to use Snowpark in Snowflake there are some more configurations you have to set up. You can find those here.
When everything is done there I can create a connection to Snowflake and initiate a Snowpark session.
from snowflake.snowpark.session import Session
from keyring import get_password
import pandas as pd

service_id = 'snowflake-trial'

connection_parameters = {
    "account": get_password(service_id, 'accountname'),
    "user": get_password(service_id, 'username'),
    "password": get_password(service_id, 'password'),
    "role": "ACCOUNTADMIN",
    "database": "HOL_DB",
    "schema": "PUBLIC",
    "warehouse": "HOL_WH"
}

session = Session.builder.configs(connection_parameters).create()
Load some data to Snowflake
For our report we have some data on the Eurovision Song Contest.
We can write this data to Snowflake with Snowpark.
contestants_df = pd.read_csv('data/contestants.csv')
votes_df = pd.read_csv('data/votes.csv')

contestants_df.columns = map(str.upper, contestants_df.columns)
votes_df.columns = map(str.upper, votes_df.columns) # To make our dataset work with the Snowpark API we need to make the columns names upper case.

session.write_pandas(contestants_df, table_name = 'CONTESTANTS', auto_create_table = True, overwrite = True)
session.write_pandas(votes_df, table_name = 'VOTES', auto_create_table = True, overwrite = True)
Using Snowpark DataFrame API and visualizing
Next, we can create a Snowpark dataframe from the database table.
contestant_sdf = session.table('contestants')
It says dataframe, but it is not existing locally on our computer.
It is an abstraction of a database table in Snowflake which we can
query with Python through the Snowpark Dataframe API. The API is like
a combination between Pandas and SQL. To display the result or use it
for anything else in a Python environment we have to turn it into a pandas
dataframe with to_pandas().
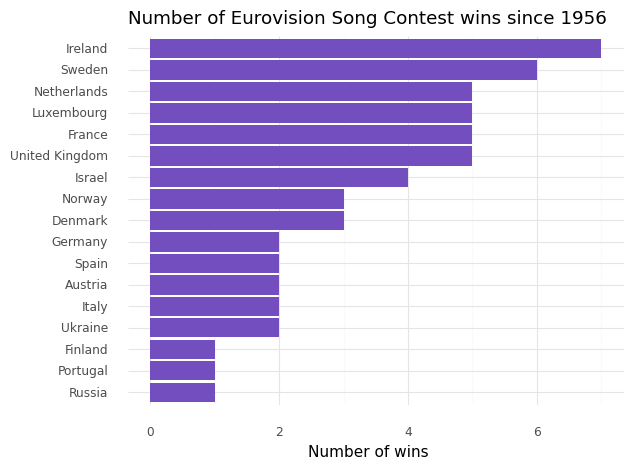
Okey, so let’s build a simple plot that shows the number of wins per country in descending order. First, we can use Snowpark to compute the number of wins per country. By doing this we are writing Python code but the actual data aggregation is executed within Snowflake.
winners = (contestant_sdf
                .filter("place_final = 1")
                .group_by('to_country')
                .count()
                .to_pandas()
                .sort_values(by = 'COUNT', ascending = False)
                .head(17)
)
Next we visualize the result.
from plotnine import labs, geom_col, geom_line, coord_flip, scale_x_discrete, theme_minimal

(ggplot(winners, aes(y = 'COUNT', x = 'TO_COUNTRY'))
 + geom_col(fill = '#724EBF')
 + coord_flip()
 + scale_x_discrete(limits=winners['TO_COUNTRY'][::-1])
 + labs(title = "Number of Eurovision Song Contest wins since 1956",
 y = "Number of wins",
 x = "")
 + theme_minimal())
Making a Quarto report
Okay, so now we know how run Python on Snowflake tables, make some pretty visualizations. Only thing left is making this into a report to share with stakeholders.
Once we have the database and the virtual environment ready putting
together a Quarto report is really is easy. In Quarto we can use
parameters in the code chunks to “echo” the code or hide it by setting
#|echo: false in a code chunk. Usually the code is not that
interesting to look at if you don’t know Python.
For this report I have changed the plotting library to Plotly for interactive plots.
This is how the report looks.
But if we want to make it into a presentation that is as easy as changing the format:
---
title: "My Eurovision Slideshow"
jupyter: pysnowpark
format:
  revealjs:
    theme: moon
---

You can take a look at the code for this report here.
Why do this?
Making beautiful reporting in Python has not been all that easy in the past. With Quarto we can create informative reports, slideshows and websites that gets our Python results closer to stakeholders. And all of this can be done without traditional reporting tools like Powerpoint or Google Slides, making our work more reproducible and less prone to error.
What a like about the Snowpark DataFrame API is that it brings data closer to the Data Scientist. I have seen many analysts and Data Scientists working primarily in the Snowflake online editor, download result of their queries and then visualize it. With Snowpark Data Scientists don’t have to switch between development environments.
This has the potential for making reporting a lot easier for Data Scientists.