In this article, I’ll introduce you to a performance testing tool called Locust. I’ll also explain why you should do performance testing in the first place. Finally, I’ll share some tips and tricks, backed up with example code, to get off to a good start with Locust.
Here’s a quick comparison of some load testing tools you might be familiar with.
| Tool | Language | Test definition | Run with | Clustering support? |
|---|---|---|---|---|
| JMeter | Java | GUI based | Run from the GUI | Yes |
| Gatling | Scala | Write with a Scala DSL | Run from command line | Kind of - read more |
| Locust | Python | Write with Python code | Run from command line | Yes |
Each one of the previous tools is excellent for performance testing! Consider using Locust if:
- Defining tests as program code doesn’t scare you off
- The JMeter GUI feels a bit clunky
- You rather use Python than a Scala DSL
Personally, I enjoy the flexibility of defining tests as program code. Since I’m using less and less Scala, Locust felt interesting. Now after studying and using Locust, I can warmly recommend it and it’s probably the tool I’m going to use in my future projects also.
Let’s start with why?
Why should you load test in every project?
Let’s be honest. Implementing load test setups, which perfectly match production is next to impossible. To do that, you need realistic data, realistic amount of load, realistic amount of CPU and so on. In real-life projects, environments are complex. Setting up a load testing environment that closely mimics production is expensive.
If getting realistic metrics is this difficult, should we just give up and trust the performance is good enough?
The short answer to this is no. We just have to give up on the common misunderstanding that load testing is done to predict the maximum number of concurrent users your system can handle. There are several benefits you can get from load testing besides the surrogate metrics of maximum performance.
The benefits I’ve seen from load testing in my projects:
- Load testing reveals clear problems in implementations. Even with a modest load, the performance seems bad. Load test results kick off the work on improvements.
- Load testing reveals surprising properties of the system. Not clear problems but something that leads to small improvements. It could be caching, logging, API design, and so on. Load test is one of the users of your system and gives you feedback from a new viewpoint.
- Performance is a complete mystery. Load testing provides you a basic level of understanding of the system’s performance.
When you run load tests in different phases of system implementation:
- You can react to potential problems early and detect changes that lower performance.
- Load testing implementation stays accurate and valid. Of course, this requires continuous maintenance. You have to consider the costs and benefits here.
- When done in different phases of system implementation, reveals a performance trend, which helps devs implement high-quality systems.
To sum this up. The only way to get accurate performance metrics from production is to monitor production. Still, load testing before entering production makes sense, because many times it leads to several minor and sometimes even major improvements in implementations. Locust is a tool that lowers the costs of implementing load testing, so let’s take a closer look at that.
A dummy application for performance testing
I implemented a small NodeJS application, which is just background information here. The Locust examples will test this dummy application.
const express = require('express');
const bodyParser = require('body-parser');

const app = express();
const port = 3000;

// Database
let books = [];

// Add a middleware to make it handle json
app.use(bodyParser.urlencoded({ extended: false }));
app.use(bodyParser.json());


app.post('/books', (req, res) => {
    const book = req.body;
    console.log(book);
    books.push(book);

    res.send('Book is added to the database');
});

app.get('/books', (req, res) => {
    const title = req.query.title;
    if (title) {
        res.json(books.filter(b => b.title && b.title.includes(title)))
    }
    else {
        res.json(books);
    }
});

app.get('/books', (req, res) => {
    res.json(books);
});


app.listen(port, () => console.log(`App listening on port ${port}!`))
A step by step Hello world with Locust
Here’s a quick tutorial on how to test the above dummy application with Locust.
Step 1: Setup
- Install Python unless you already have it
- Optional/recommended: create a Python virtual environment with
python3 -m venv envand activate it withsource env/bin/activate. - Install Locust with
pip install locust
Step 2: Define your tests in a locustfile.py
A simple locustfile.py looks like this:
from locust import HttpUser, between, task


class WebsiteUser(HttpUser):
    # How long a simulated user should wait between executing tasks
    wait_time = between(3, 10)

    # A User will call its on_start method when it starts running
    def on_start(self):
        self.client.post("/books", {
            "isbn": "9781593275846",
            "title": "Eloquent JavaScript, Second Edition",
            "author": "Marijn Haverbeke"
        })

    # When a load test is started, an instance of a User class will be created for each simulated user.
    # Each user will start running within their own green thread.
    # When these users run they pick tasks that they execute, sleep for a while, and then pick a new task and so on.
    @task
    def search_all(self):
        self.client.get("/books")

    @task
    def search_with_filter(self):
        self.client.get("/books?title=JavaScript")
Step 3: Run Locust
You can run Locust either in headless mode or using a web interface.
Example of running in the headless mode:
(env) ➜  locust-tests locust --headless --host http://localhost:3000
[2021-04-15 13:23:32,380] MACW52LEHTD8/INFO/locust.main: No run time limit set, use CTRL+C to interrupt.
[2021-04-15 13:23:32,380] MACW52LEHTD8/INFO/locust.main: Starting Locust 1.4.4
[2021-04-15 13:23:32,381] MACW52LEHTD8/INFO/locust.runners: Spawning 1 users at the rate 1 users/s (0 users already running)...
Hitting ctrl+c prints out a report:
 Name                                                          # reqs      # fails  |     Avg     Min     Max  Median  |   req/s failures/s
--------------------------------------------------------------------------------------------------------------------------------------------
 POST /books                                                        1     0(0.00%)  |      76      76      76      76  |   12.28    0.00
 GET /books?title=JavaScript                                        1     0(0.00%)  |       4       4       4       4  |   12.28    0.00
--------------------------------------------------------------------------------------------------------------------------------------------
 Aggregated                                                         2     0(0.00%)  |      40       4      76       4  |   24.57    0.00

Response time percentiles (approximated)
 Type     Name                                              50%    66%    75%    80%    90%    95%    98%    99%  99.9% 99.99%   100% # reqs
--------|--------------------------------------------|---------|------|------|------|------|------|------|------|------|------|------|------|
 POST     /books                                             76     76     76     76     76     76     76     76     76     76     76      1
 GET      /books?title=JavaScript                             4      4      4      4      4      4      4      4      4      4      4      1
--------|--------------------------------------------|---------|------|------|------|------|------|------|------|------|------|------|------|
 None     Aggregated                                         76     76     76     76     76     76     76     76     76     76     76      2
You can use command line parameters or write a file named locust.conf:
headless = true
host = http://localhost:3000
users = 1
spawn-rate = 1
run-time = 30sec
Locust web interface
In addition to running Locust in headless mode, you can start the web interface by simply runnig the command locust:
(env) ➜  locust-tests locust
[2021-04-15 13:01:41,216] INFO/locust.main: Starting web interface at http://0.0.0.0:8089 (accepting connections from all network interfaces)
[2021-04-15 13:01:41,230] INFO/locust.main: Starting Locust 1.4.4
The web interface in http://0.0.0.0:8089 looks like this:
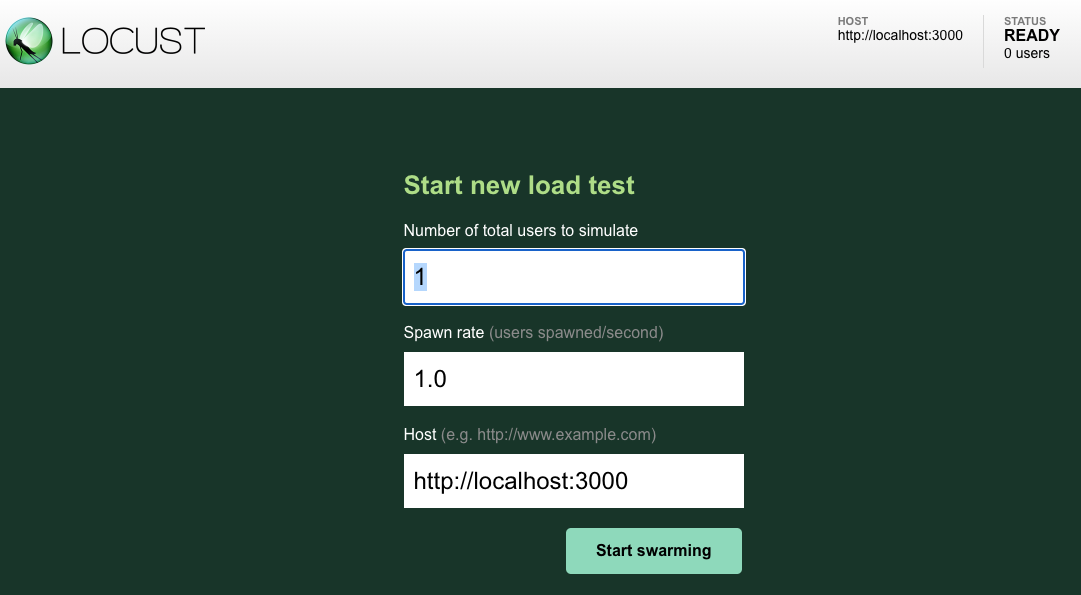
You can fill in the parameters and start the load tests.
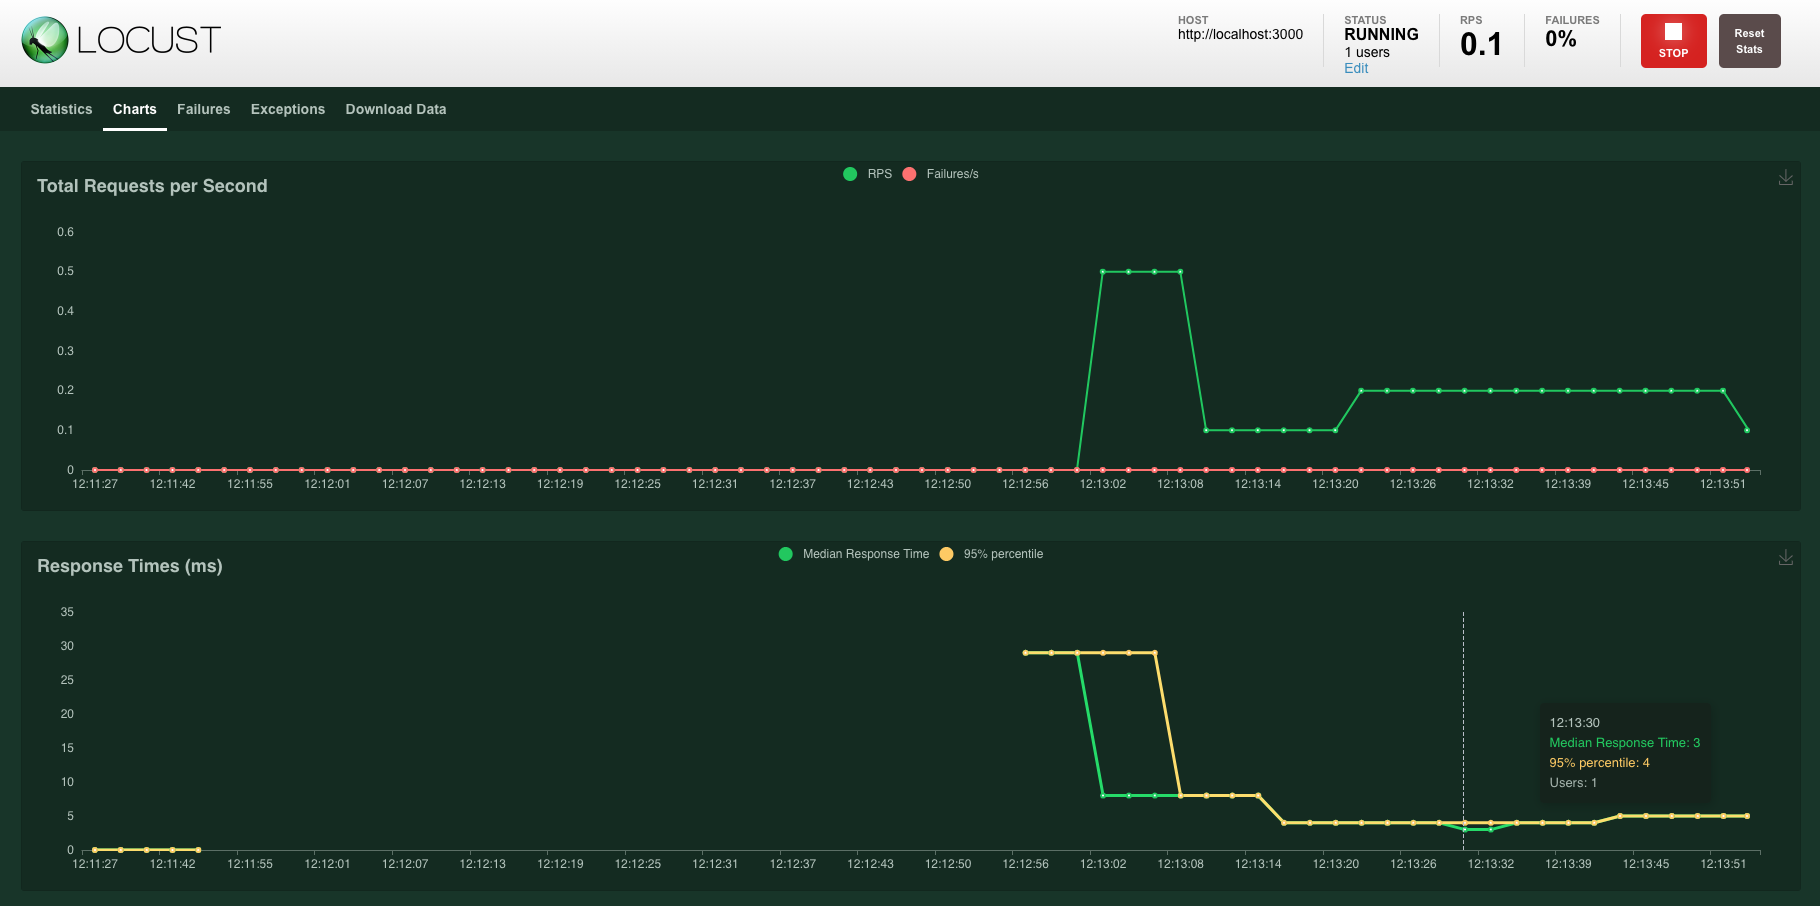
Stats and graphs that update in real-time
Locust provides you with a nice-looking UI with stats and graphs that update in real-time. You can hit the Stop button to stop the tests.
You can read more from the Locust documentation: https://docs.locust.io/en/stable/index.html
I’ve felt that the documentation is well written and easy to follow. Locust looks like a mature open source product.
Tips on using Locust
How to structure the test code?
When the locustfile.py grows too big, I’ve structured the test code like this:
- locust.conf (parameters such as the number of users)
- locustfile.py (the users and their tasks and nothing more)
- api.py (API client which is used by the tasks in locustfile.py)
- testdata.py (test data builder / json for the API calls)
- credentials.py (usernames and passwords for the API calls)
With this structure, the locustfile stays clean and it’s easier to see what the users are doing.
API client to simplify the test definitions
To keep the dirty details of authentication and json structure out of the locustfile.py you can
implement a wrapper class, which makes the actual API calls.
In the context of libraries and books it could look like this:
# api.py

import credentials

class Api:
    def __init__(self, client):
        self.client = client

    def add_book(self, library_guid, book_isbn, book_title):
        self.client.post("/books", auth=credentials.LIBRARIAN_AUTH, json={
            "library_guid": library_guid,
            "isbn": book_isbn,
            "title": book_title,
            "author": "Some Author"
        })
        return book_isbn

    def search_all(self):
        self.client.get("/books", auth=credentials.ONLINE_LIB_USER_AUTH)

    def search_by_title(self, title):
        self.client.get("/books?title=" + title, auth=credentials.ONLINE_LIB_USER_AUTH, name="/books?title=:title")

    def delete_book(self, book_isbn):
        # The name parameter groups the calls with different ISBNs to a single line in the report.
        self.client.delete("/books/" + book_isbn, auth=credentials.LIBRARIAN_AUTH, name="/books/:isbn")
When you have the API client ready, using it from the locustfile.py is a blast:
class OnlineLibraryUser(HttpUser):
    wait_time = between(3, 10)

    def on_start(self):
        self.api = api.Api(self.client)

    @task
    def search_all(self):
        self.api.search_all()

    @task
    def search_with_filter(self):
        self.api.search_by_title("JavaScript")


class LibraryAdminUser(HttpUser):
  wait_time = between(3, 10)

  def on_start(self):
    self.api = api.Api(self.client)
    self.my_books = []

  @task
  def add_books(self):
    self.my_books.append(
      self.api.add_book(testdata.get_random_existing_library_guid(),
                        testdata.get_next_isbn(),
                        testdata.get_random_book_title())
    )

  def on_stop(self):
    [self.api.delete_book(isbn) for isbn in self.my_books]
Test data setup and clean up
Sometimes you need to set up some data, which is then used by the tasks. For instance, you might have an existing database of libraries, which you will use and add books to.
In the testdata.py, you could have something like this:
# testdata.py

LIBRARY_GUIDS = [
    '8DFC621C-375D-EB11-A864-00155DAD2A3A',
    '4656CA50-715C-EB11-A864-00155DAD2A3A',
    '440CC25C-715C-EB11-A864-00155DAD2A3A',
    '1022C256-715C-EB11-A864-00155DAD2A3A',
]

ISBN_SEQUENCE = list(range(30000, 20000, -1))

def get_random_existing_library_guid():
    return random.choice(LIBRARY_GUIDS)

def get_next_isbn():
  return str(ISBN_SEQUENCE.pop())
Then, in the locustfile.py you define the on_start and on_stop methods for setup and cleanup:
# locustfile.py

import testdata

class OnlineUser(HttpUser):
    # When the instance of this user starts, we provide it with an api client, a library and a book to operate.
    def on_start(self):
        self.library_guid = testdata.get_random_existing_library_guid()
        self.isbn = testdata.get_next_isbn()
        # Initialize an API client for this user
        self.api = api.Api(self.client)
        # Insert a book, which can be searched and operated by the tasks
        self.api.insert_book(self.library_guid, self.isbn)

    # When the instance of this user stops, the initialized test data is deleted.
    def on_stop(self):
        self.api.delete_book(self.isbn)

    @task
    def loan_a_book(self):
      self.api.loan(self.library_guid, self.isbn)
Load testing in CI/CD pipeline
CI/CD is adopted in many projects and you probably have some automated tests already. What if you want to test performance and detect possible performance regressions? You have at least two options to do this.
Running Locust with a simple shell command
The simplest way of adding Locust to your build pipeline is to add a step and just call locust.
After that, you can check the (console) output to see the stats.
The build fails if there are any errors in calls made by Locust.
In Jenkins, an “Execute Shell” -build step can run Locust and fail the build if return value from Locust is anything else but 0. The same principle works with Github Actions. The following GitHub action can help you with the setup: https://github.com/marketplace/actions/locust-load-test
Response time tracking across builds
What if you want response time tracking across builds?
With Jenkins, you can use the Performance Plugin, which works with most of the popular Open Source load testing tools including Apache JMeter, Gatling, Grinder, and Locust. For more information, read http://jenkinsci.github.io/performance-plugin/RunTests.html.
There is a Github Action for continuous benchmarking, but it doesn’t support Locust out of the box. I couldn’t find an example of Locust, Github Actions and continuous benchmarking. It would be fun to experiment with this! You can configure Locust to output the results in csv format. Maybe you could push the CSV-report to a Github Pages branch or perhaps Amazon S3? Visualizing CSV data is straightforward with many open source graphing tools.
Summary
In my opinion, some level of load testing makes perfect sense in pretty much every project that goes to production. In addition to providing surrogate metrics of system performance, it is likely to see surprising results and benefits you can get from performance testing.
Locust is a Python based load testing tool, that just recently skyrocketed to the list of “my favorite developing tools”, because it’s easy to use and easy to understand.
You can find the full source code of this blog post from https://github.com/janneri/locust-tutorial. This repo contains a sample NodeJS app that is tested and an example of Locust test implementation.
Thanks for reading and happy load testing with Locust!