This is the second part of the blog post where I talk about the things you should know when working with AWS Kinesis Data Streams. You can find Part 1 here.

Sunrise at Gullfoss, Iceland, 2016
Reading from a stream
By now, we have gone into quite some details when it comes to writing your data to a Kinesis stream. How about making use of that data, aka reading it from the stream? Once again, this is not going to be a short read. But I hope you enjoy it nevertheless 🙂 Now, if you are ready, let’s take a deep breath and dive in!
All these consumers
As with writing to a stream, there are a bunch of ways to consume data from a stream.
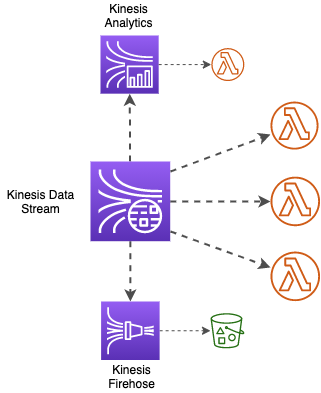
But first, let’s take a short detour. Kinesis family has two more extremely useful services to work with streaming data:
- Kinesis Data Firehose, which is meant to load data to a destination with plenty to choose from (think S3, Redshift, even HTTP endpoints), and
- Kinesis Data Analytics, which can run queries on your streaming data in near real-time.
I won’t be going into details of those services here, each of them deserves an own blog post (or two 😉). I will just say that both Kinesis Firehose and Kinesis Data Analytics can be used as stream consumers, providing you with out-of-the-box possibilities to analyze the data being streamed, as well as to deliver your data to a destination of your choice.
One of the main superpowers of a Kinesis stream, though, is that you can attach custom data consumers to it to process your data in any way you prefer, in near real-time. There are once again plenty of options to choose from.
If you are inclined to do so, you can use an EMR cluster as your custom consumer. Or, as with writing to a stream, there are a lot of third-party tools that integrate with Kinesis Streams. Think of possibilities like Databricks and Apache Spark integration, among others.
On a perhaps more familiar side of things, you can have your own consumer application reading from the stream. For that purpose, you can once again use either AWS SDK or Kinesis Consumer Library (KCL), which is the counterpart of the already familiar KPL and which I’ll be mentioning briefly.
And finally, you can use AWS Lambda as your stream consumer, which gives you all the scalability, resilience, and awesomeness that comes with it. You might have already guessed that AWS Lambda is exactly what I’ll be focusing on in this post 🙂
But first, let’s lay some groundwork.
Consuming the stream, two ways
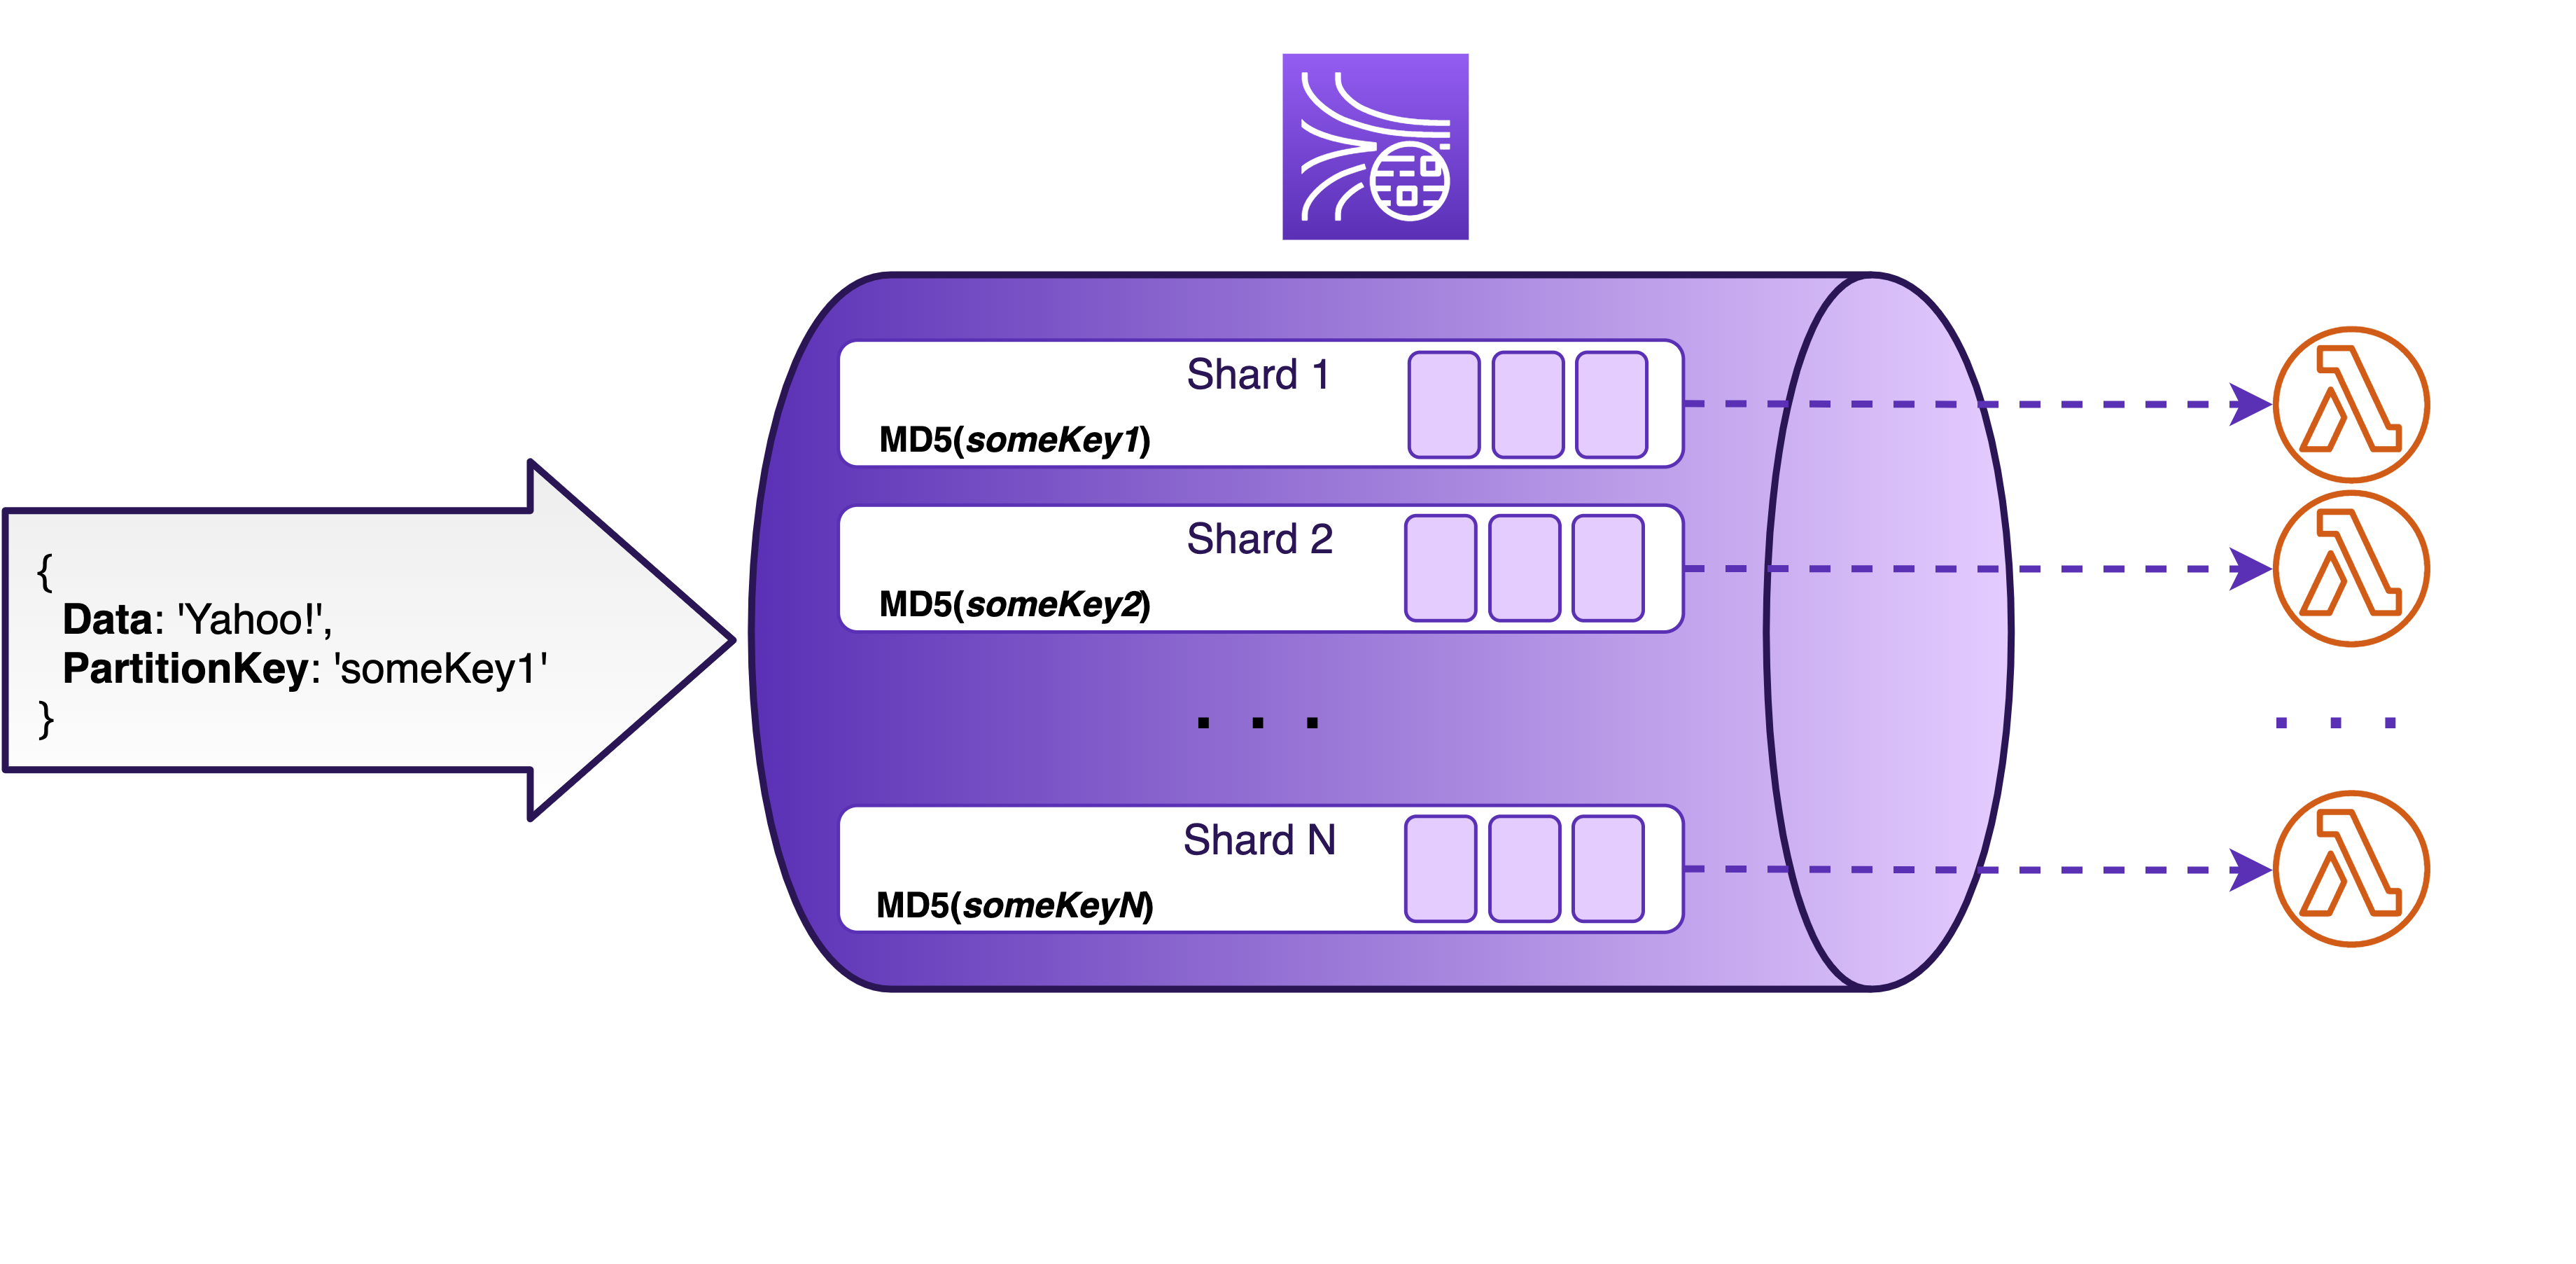
As with writing to a stream, when reading from it it’s important to know that Kinesis stream is composed of shards, and that each shard in your stream comes with a limited throughput: you can write 1 MB or 1 000 records of data per second, while on the way out, each shard provides up to 2 MB of data per second by default. So, in theory, you can consume the stream twice as fast as you can write to it.
Shared throughput
Now, this might not seem too exciting at first. However, the higher outgoing throughput also means that you can actually have at least two different consumers reading from the same Kinesis stream at all times.
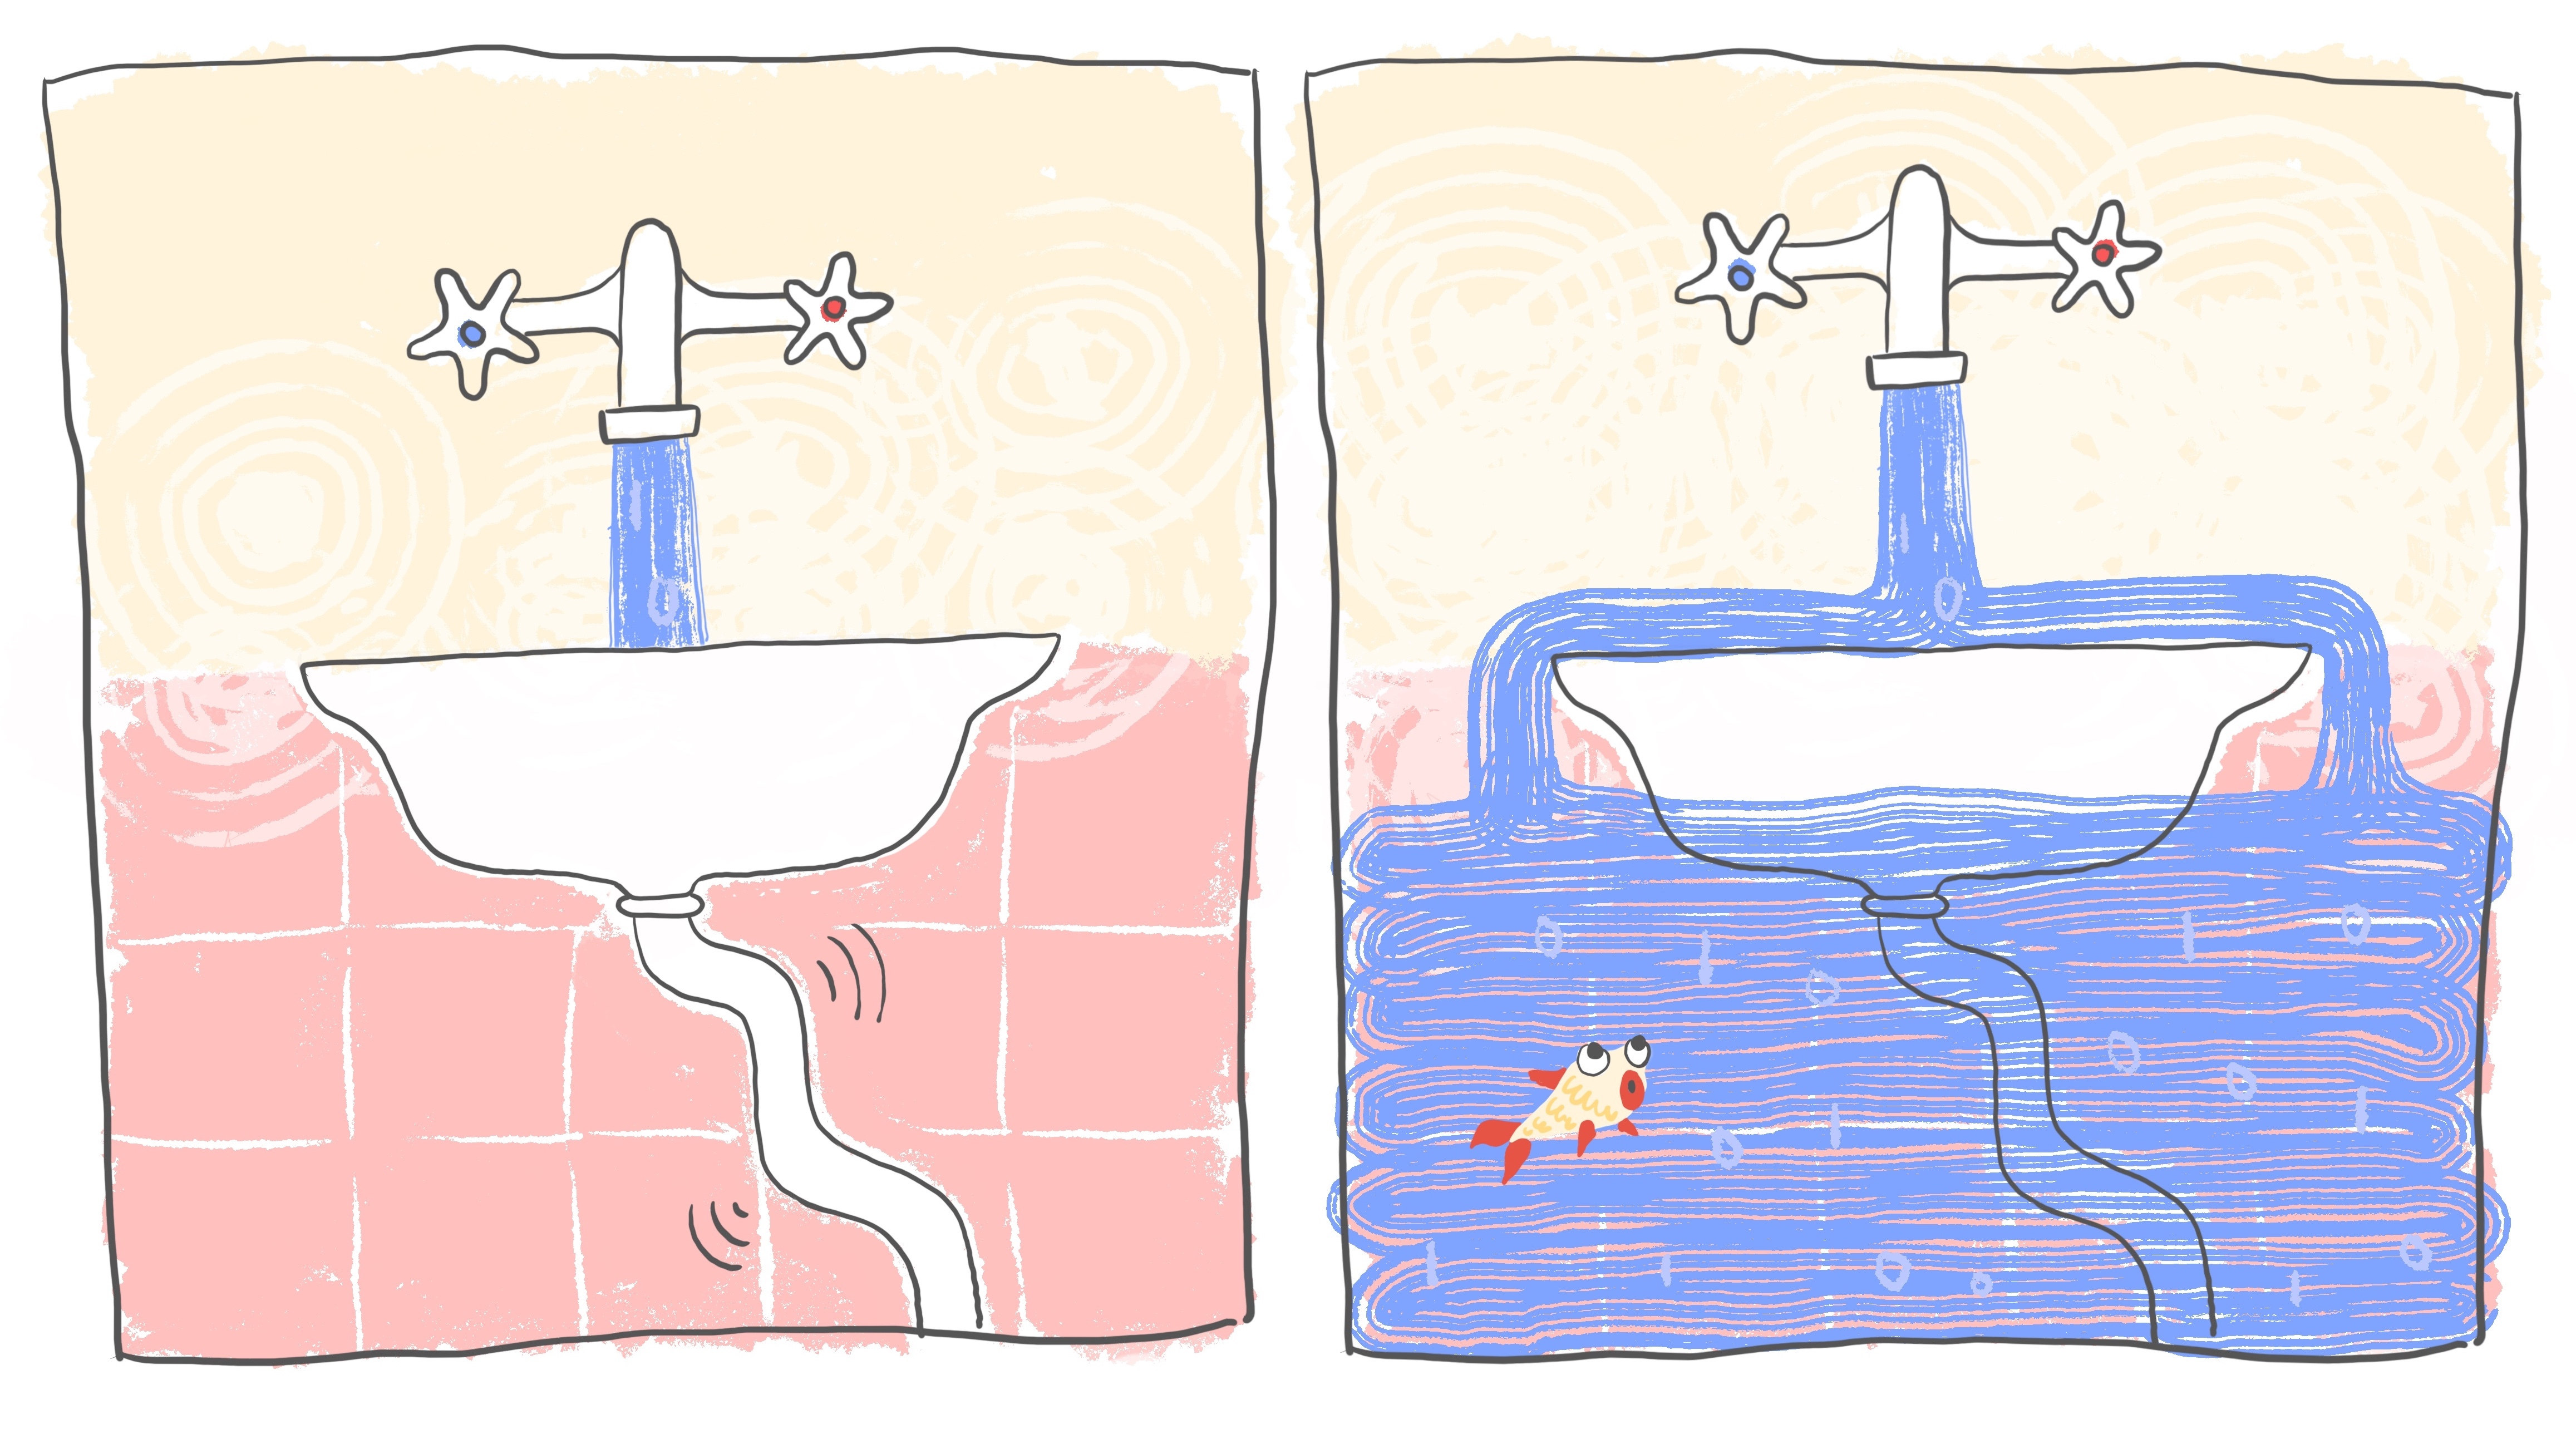
A thing to remember here is that, by default, the 2 MBs are shared between all the consumers you attach to the stream. So, if you would want to have more than the recommended two to three consumers, you may face a situation when the data is being written to the stream faster than it can be read. This in turn may lead to some of the data expiring (that is, being deleted from the stream) before any of the consumers get a chance to read it. You can think of it as a sink that you pour water into: if you do it faster than it can be drained, your sink ends up overflowing, and you get water all over your floor. We will be returning to this unfortunate scenario on several occasions.
Too many consumers
To add more weight to the situation, direct integration with Kinesis Data Analytics and Kinesis Firehose use this shared throughput of 2 MB when acting as stream consumers. So, to be on the safe side, you are supposed to add just one custom consumer to the stream if you are using any of those direct integrations.
But wait: what if you are feeling greedy and want even more ways to process your data from a single stream? For example, you may have a Kinesis Firehose writing data to S3, a Kinesis Analytics application doing some real-time data aggregation, but you also want to add a few Lambda functions for custom processing.
As we established, if all of the consumers are sharing the throughput of 2 MB, they might start lagging behind the stream, and you may end up losing your data as a result.
But worry not! There is one more way to consume your stream and it’s called enhanced fan-out.
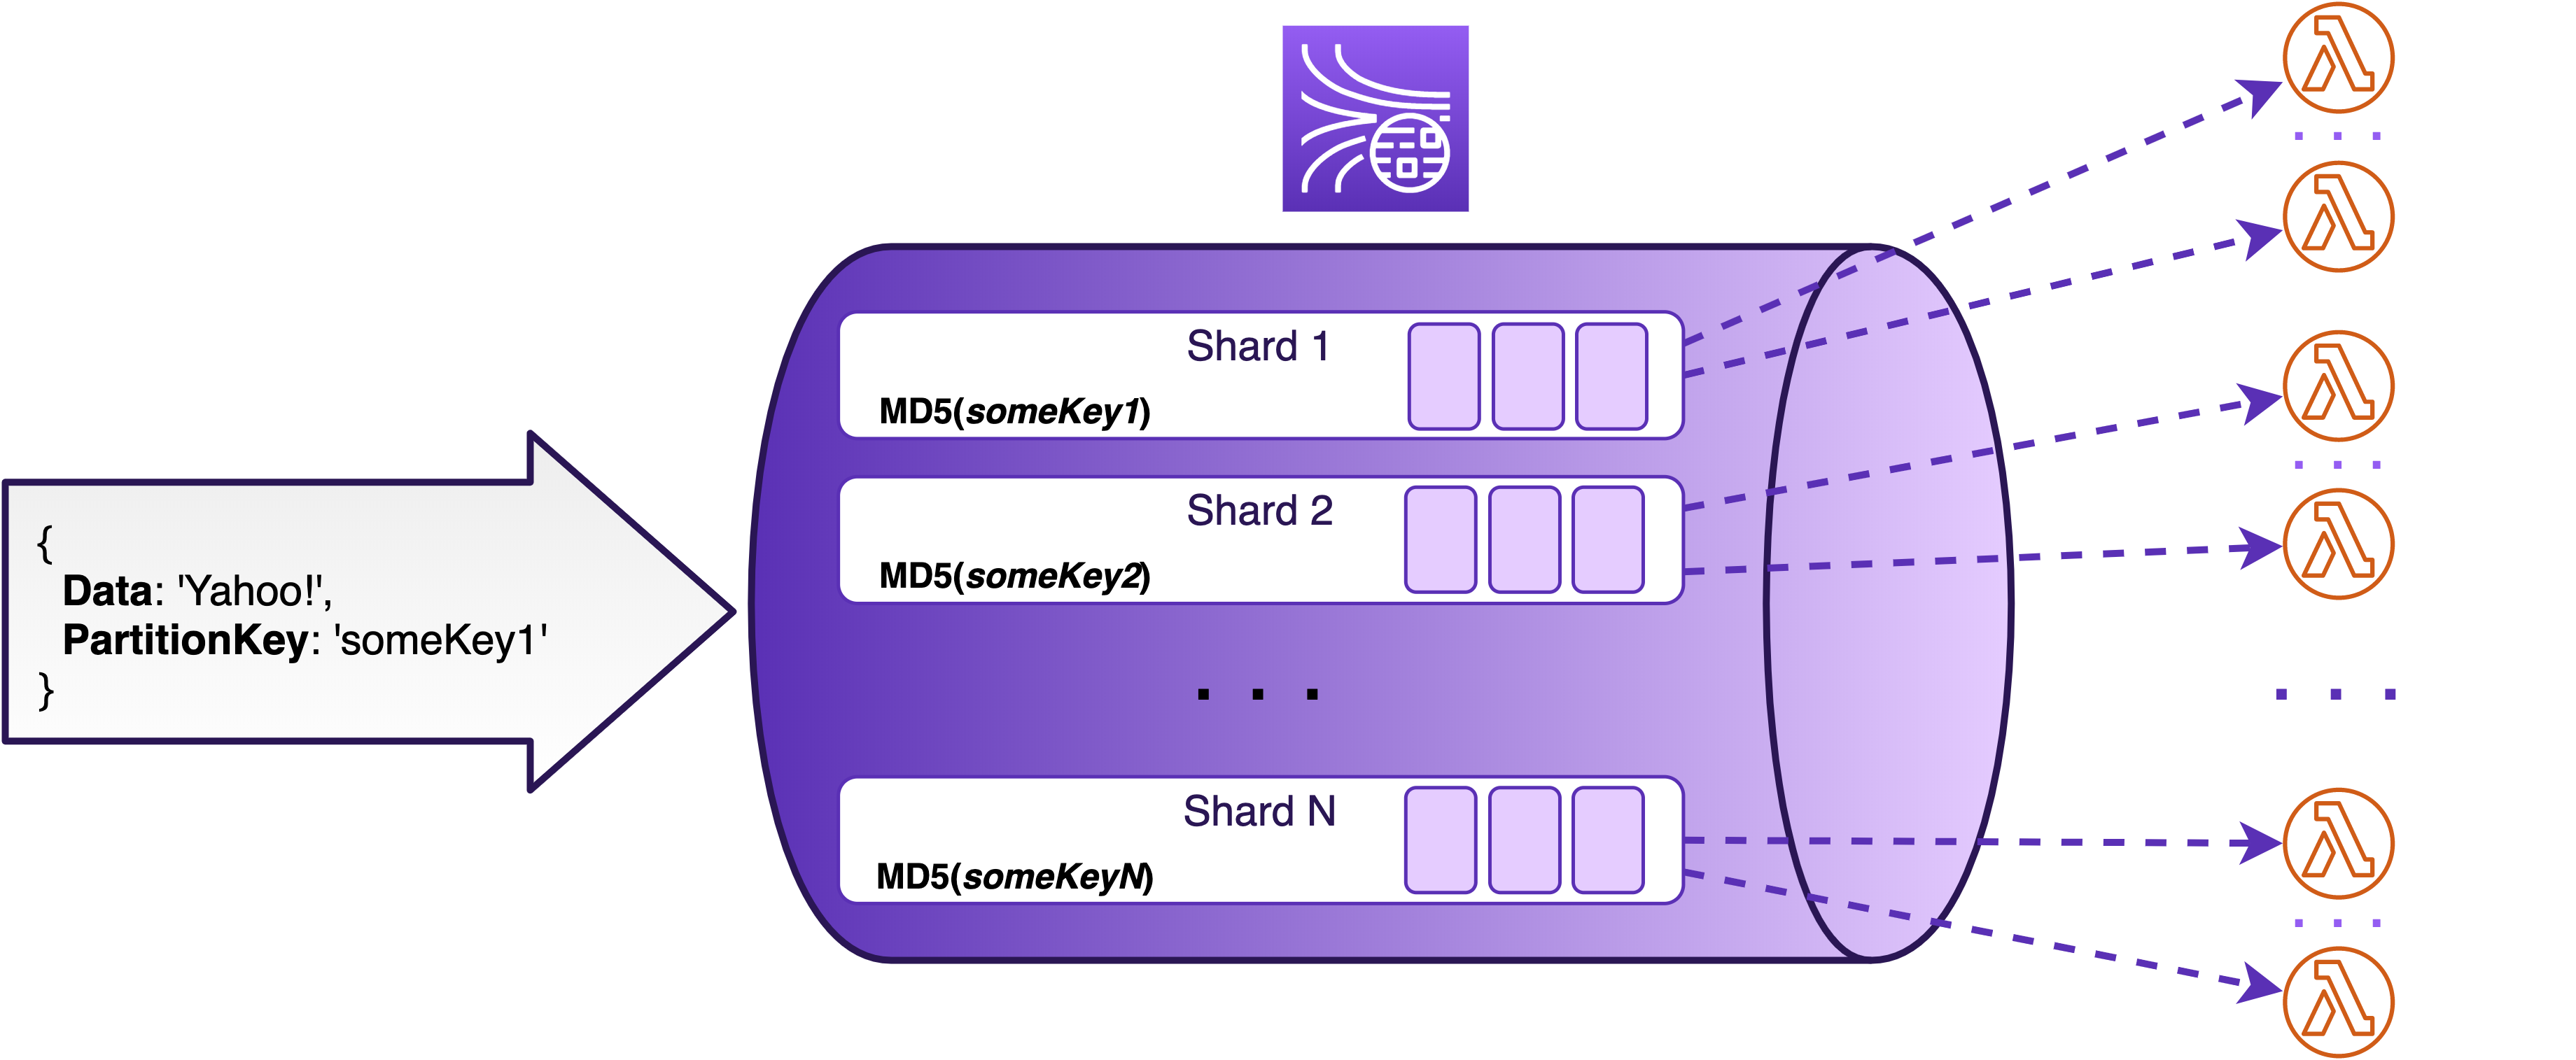
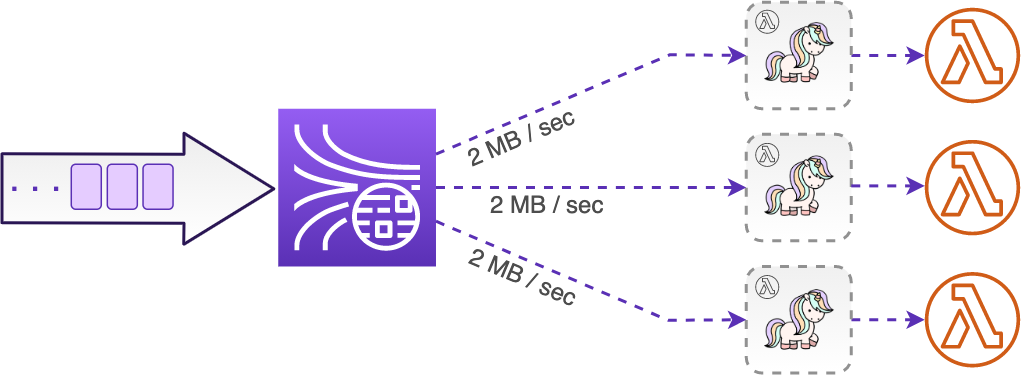
Enhanced fan-out
Instead of sharing the throughput of 2 MB per second per shard with other consumers, enhanced fan-out is an “elite” way to read from a stream, where each custom consumer will have its own dedicated throughput of up to 2 MB per second per shard. In fact, as of today, you can have up to 20 such “elite” consumers attached to a single stream!
Although direct integrations with EMR, Kinesis Firehose, or Analytics can only use the shared throughput, the great news is that you can use enhanced fan-out with your custom consumers. In consumer applications using KCL, enabling enhanced fan-out is just a matter of configuration. With custom consumers using either AWS SDK or AWS Lambda you need to create a so-called enhanced stream consumer first.
I know, naming gets confusing here, but bear with me…

Sunset at Icefields Parkway, Alberta, Canada, 2018
You can think of an enhanced consumer for Lambda (or SDK) applications simply as of an isolated connection to your stream, sort of a private highway of yours. All it takes to create such an enhanced consumer is a simple API call. You could also use CloudFormation or SAM, or you can just run this simple AWS CLI command:
aws kinesis register-stream-consumer --consumer-name my_highway \
      --stream-arn arn:aws:kinesis:<region>:<account_id>:stream/the-best-stream
Though apparently there’s no way to register an enhanced consumer through the AWS Kinesis console yet (if you find one, let me know!), you can list and delete the existing ones:
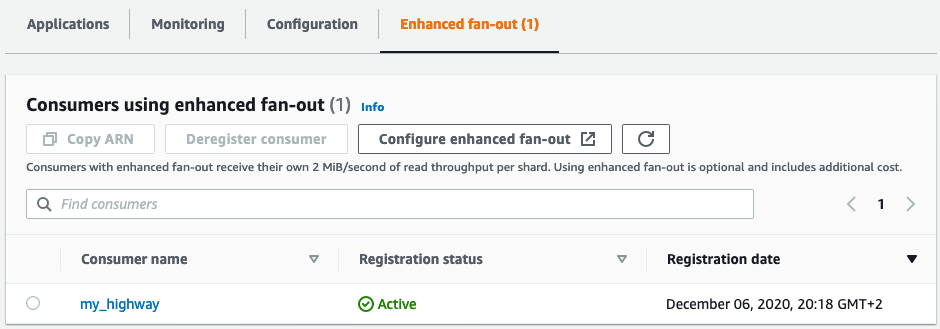
In the case of AWS Lambda, you can use this enhanced consumer when configuring a Kinesis trigger for your function. Note that you can only have a single Lambda function using a given enhanced consumer. You will need to create a separate enhanced stream consumer for each of your Lambda stream consumers.
Which one to choose?
Though the dedicated throughput sounds great on its own, this is not the only perk you are getting with enhanced fan-out. Together with it comes an even lower read propagation latency, aka the time between when the data is written to the stream and when it is consumed. This is in part due to the dedicated throughput “highway” each consumer is getting, and in part to the fact that enhanced fan-out uses HTTP2 instead of HTTP, allowing to have persistent connections and to push records to the consumers, instead of consumers polling the stream.
When using enhanced fan-out, you will have records available to be processed about 70 ms after you wrote them to the stream. In comparison, this takes about 200 ms for the shared throughput consumers, and the latency increases with each additional consumer that shares the throughput. Why is that? You will have to keep reading to find out 😉
By now, you might be thinking: why would anyone use shared throughput at all? One important reason is this: while the standard, shared throughput consumers normally read the data for free, you will have to pay for having all the perks of enhanced fan-out. You will pay for both the amount of data consumed, as well as the number of consumers per shard.
So, your highway turns out to be a toll road.
Too many consumers are barely enough
Finally, you don’t need to choose one way of consuming the stream over the other. In the same way that you can mix and match different types of consumers (direct service integrations with Kinesis Firehose and Analytics, Lambda functions, etc.), you can also use both shared throughput and enhanced fan-out with the same Kinesis stream.
This allows you to have up to 20 consumers with dedicated throughput, as well as 2-3 consumers that will share the 2 MB throughput.
Lambda
Let’s now finally talk about Lambda!
When using Lambda as a stream consumer, it takes care of a lot of heavy lifting on your behalf behind the scenes. For instance, it handles record batching and keeps track of all the open shards in the stream, together with the “bookmarks” within each shard, to know where exactly it should read the next records from (remember that a Kinesis stream retains your data even after it has been read, so each consumer needs to take care of tracking its own position within the stream). Lambda will also handle errors and retries when things go wrong.
Let’s look a bit deeper into how exactly AWS Lambda works with Kinesis Streams.
Magic of the ESM
Right from the start, we need to make a clear distinction between the Lambda service and the Lambda function. While Lambda function is what you will deal with most of the time, the actual function instance being invoked, Lambda service is what does all the magic behind the scenes and makes it so powerful. An essential and often overlooked part of the Lambda service is the event source mapping, or the ESM for short.
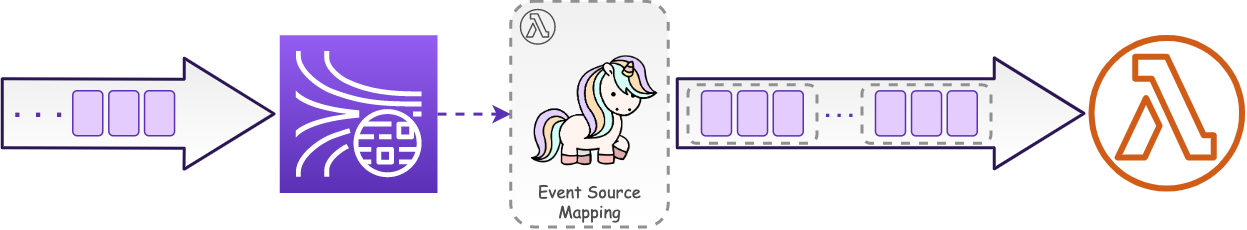
When attaching a Lambda function to consume a Kinesis stream, you are in fact attaching an event source mapping and pointing your Lambda function to it. The ESM will read batches of records from the stream and invoke your Lambda function for you. It is also used with Lambda triggers like SQS and DynamoDB Streams. In case of service integrations where there is no ESM involved and Lambda is triggered directly (e.g. with an SNS or CloudWatch Event trigger), there can be no batching.
Event source mapping is your invisible magical ingredient that is behind all that we are going to discuss next.
Batches and windows
As we know by now, each shard in a Kinesis stream can be thought of as a separate queue with its own throughput limitations. When writing to a stream, the partition keys help Kinesis distribute records among all the available shards. When reading from the stream, it’s the consumers’ responsibility to take care of reading from all the available shards in parallel. The way Lambda handles this is by triggering a separate concurrent Lambda invocation to read records from each dedicated shard. So, by default, you will have as many concurrent Lambda invocations reading from your stream as you have shards.
With the help of the ESM, each invocation of your Lambda function gets a batch of records from a single shard. You can choose what is the size of batches that you want to process (configuring the batch size from 1 to 10 000 records per batch) and how often do you want to process them (specifying the batch window from the default 1 sec up to 5 min).
The event source mapping will then diligently collect records from a specific shard into a batch until one of the three things happens:
- your desired batch size is achieved,
- your desired time window has passed, or
- the batch gets so big that it reaches Lambda’s own synchronous invocation payload limit of 6 MB.
After that, the ESM invokes your Lambda function synchronously and passes to it the batch it has collected. The input of a single Lambda function may look like this:
{
  Records: [
    {
      kinesis: {
        kinesisSchemaVersion: '1.0',
        partitionKey: 'someKey1',
        sequenceNumber: '123',
        data: 'SSB3YW50IHRvIHdyaXRlIHRoaXMgdG8gYSBzdHJlYW0=',
        approximateArrivalTimestamp: 1607282941.778
      },
      eventSource: 'aws:kinesis',
      eventVersion: '1.0',
      eventID: 'shardId-0000:12345',
      eventName: 'aws:kinesis:record',
      invokeIdentityArn: 'arn:aws:iam::<account_id>:role/the-best-role',
      awsRegion: 'eu-west-1',
      eventSourceARN: 'arn:aws:kinesis:eu-west-1:<account_id>:stream/the-best-stream'
    }
  ]
}
There is an array of records, each containing record payload and some metadata. The data payload itself is base64 encoded, so you will need to decode it first:
const decodedDataStrings = event.Records.map((record) => Buffer.from(
   record.kinesis.data, 'base64'
).toString('utf8'))
Each record contains an approximate timestamp of when it was written to the stream (approximateArrivalTimestamp). It also contains a unique number that identifies the record within a shard (sequenceNumber). It is used by the ESM to process records in order and to track which record should it read next. It can also be very useful if your Lambda function fails to process the batch it receives. But I’m getting ahead of myself again 🙂
If you have a relatively low throughput stream, you might want to adjust the batch window to be larger than the default 1 sec. Even though a Lambda function won’t normally be invoked with an empty batch, a time interval that is too small might not be sufficient to collect the entire batch. This means that your Lambda function will be triggered more often than it would be necessary.
Parallelization factor
What if you have a high throughput stream instead, and your Lambda just can’t keep up with the amount of data that comes in? Because there is a separate Lambda invocation associated with each shard, one way to increase the processing speed is by simply adding more shards to the stream. Each new shard comes with one additional Lambda invocation to process the data.
However, as we know, each shard will cost you. Resharding is also an operation that takes time and has its own limits.
Instead of adding more shards to your stream, you can add more Lambda functions to read from each shard. This is called a parallelization factor and you can set it to up to 10, to have up to 10 concurrent Lambda executions per each shard in your stream. Once again, brought to you by the magic of the event source mapping.
What about the ordering of records in a stream when a parallelization factor is used? I’m glad you asked! We know that when we write data to a stream, we get a guaranteed ordering of records within a single shard. With one Lambda function processing records from each shard, this order is preserved when consuming a stream. But what if we have multiple Lambda functions reading from the same shard?
Let’s take a look at what happens when we configure a parallelization factor on our event source mapping.
Inside a Kinesis stream, records are routed to different shards based on their partition keys. Each shard only allows records within a specific range of partition key hash values. With a parallelization factor, the ESM further splits each shard into internal “parallelized” sub-shards. Each of those hidden sub-shards is once again assigned a range of non-overlapping partition key hash values, just like your ordinary shards. And just like the ordinary shards, each sub-shard comes with its own dedicated Lambda invocation.
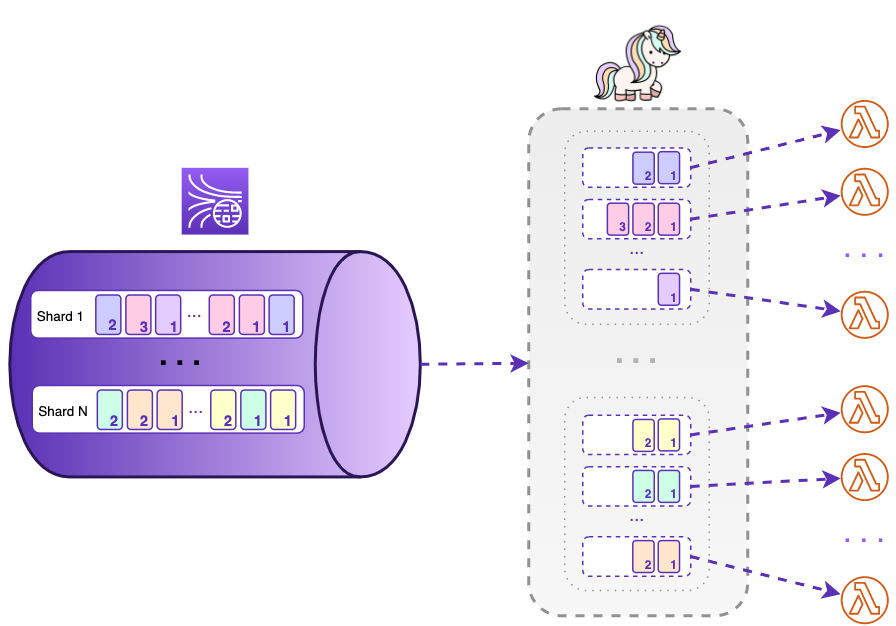
All this means that when you parallelize the processing of each shard, strict ordering within the shard can not be guaranteed any more. Instead, your records will be ordered for the individual partition keys.
Failures
No discussion can be complete without talking about failures. Well, maybe some can, but this is not one of those 🙂
As with writing to a Kinesis stream, reading from it may fail. While there are plenty of reasons why this may happen, in the case of Lambda consuming a Kinesis stream, we can separate two possible failure scenarios:
- System errors, when something goes wrong behind the scenes before invoking the actual Lambda function, while Lambda service is trying to read a batch of records from a shard;
- Errors within the Lambda function itself while trying to process the batch of records it received from the ESM.
The great thing is, the ESM will take care of the system errors on your behalf. We will be returning to this shortly.
But what happens when an error occurs while processing the batch of records in the Lambda function itself? Let’s focus on this scenario first.
Lambda function failures: the good, the bad …
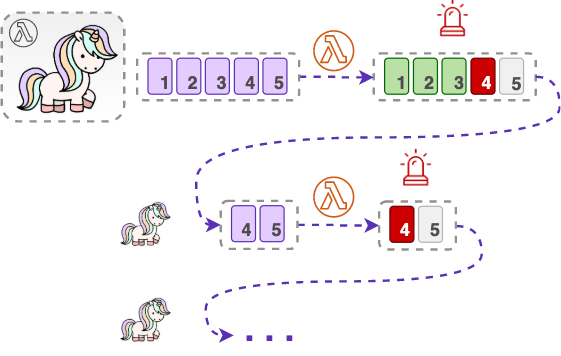
The good news is there is a built-in retry functionality in the Lambda service in case things go wrong. By default, Lambda will try to process a batch of records over and over again, until it succeeds or until the records in the batch expire. The bad news is if a batch contains a “bad” record that cannot be processed at all you might end up in some trouble.
We have learned in Part 1 that data in a Kinesis stream expires after a minimum of 24 hours. Let’s see what happens in such a stream if a batch contains a “bad” record.
In this unfortunate scenario, by default, Lambda will be retrying the “bad” batch unsuccessfully for 24 hours, causing a substantial number of fruitless Lambda invocations. What if you have configured your stream to have a longer retention period. How about 7 days? Or even, one year? Well, in that case, you got yourself a year’s worth of some unnecessary Lambda invocations.
Moreover, those fruitless retries will likely cause multiple reprocessing of some of the records. You see, from the perspective of the ESM, either the entire batch succeeds or fails. When a Lambda function throws an error because of that one “bad” record, it causes the entire batch to fail and to be retried all over again, even if some of the records in that batch were already successfully processed before the error occurred.
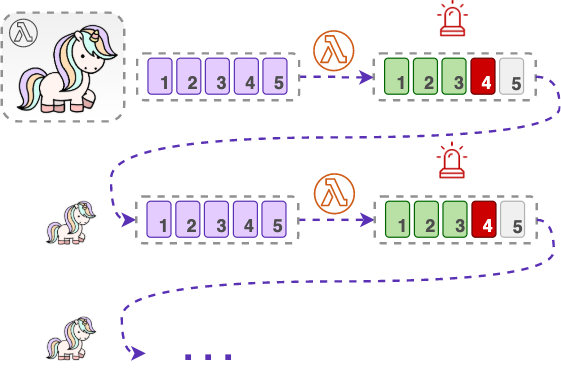
Finally, 24 hours later, the data expires and is removed from the stream, partly unprocessed. When this happens, you end up losing not only that one “bad” record that was causing the problem but the entire batch of your valuable data.
But bad things don’t stop there, quite the contrary.
The thing is, while Lambda keeps retrying that one unfortunate batch from the shard, no other batches are being read from that shard. This, of course, is a reasonable thing to do while otherwise Kinesis and Lambda would not be able to guarantee ordering of records within a shard. However, it also means that because of just one “bad” record, your entire shard is now stuck, while the rest of the shards in your stream go on with their lives. That’s why this “bad” record is often referred to as a poison pill.
In our scenario, in 24 hours the poison pill finally leaves the shard, together with the rest of the records that were unlucky enough ending up in the same batch. But at that moment when Lambda can finally start taking in new batches, the shard is potentially filled with records that were written to the stream around the same time. This, in turn, means that they expire around the same time as the already discarded batch.
So, you may end up in a situation, where your Lambda function just doesn’t have enough time to catch up with the shard and your records will keep on falling off the edge of the stream (remember our overflowing sink analogy?).

Even though we started off with just one “bad” record which could not be processed, we ended up losing a lot of valid and valuable data. All this because we didn’t have proper error handling.
The good news is that there are several ways to mitigate these kinds of situations.
Gain control
First and foremost, you should decide how to proceed with the poison pill records, not to let the entire function fail because of some “bad” records in the batch. Do you want to log information about the record? Maybe emit some custom metrics? How about sending the record to a DLQ? Or, maybe, you could afford to discard the “bad” records silently?
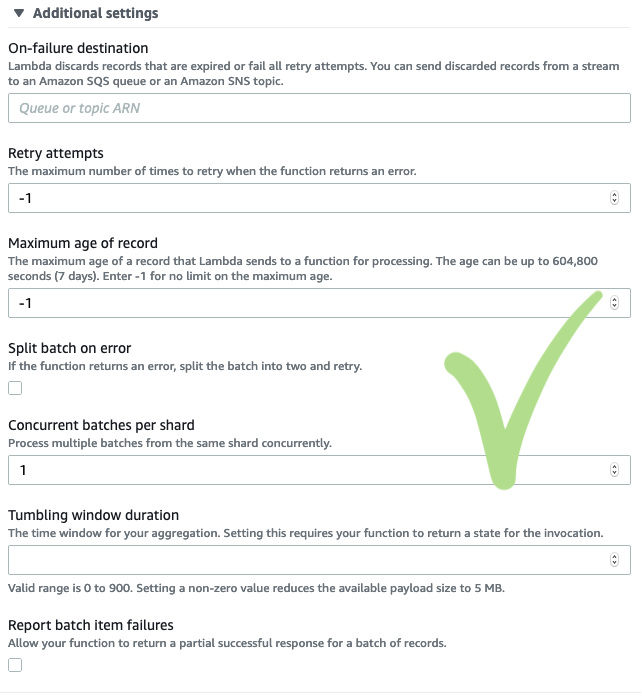
You could then implement the corresponding error handling in your Lambda function. But that’s not the only option you have. To even further reduce the negative side effects of poison pill records and other failures, you should combine error handling in your code with the magic of the ESM, which allows to:
- set the maximum number of retry attempts for Lambda (max 10 000),
- set the maximum age of the records that Lambda will retry and ignore ones that are getting old (from 1 minute up to 7 days),
- recursively split the “bad” batch for you and try to process the halves separately (also called batch bisecting), or
- return a partial success for the part of the batch that has been processed successfully.
What this last option means is that instead of failing the entire batch, you can tell the ESM which record was it exactly that failed. To do that, you just need to enable the ‘Report batch item failures’ setting for the ESM and return the sequence number of the failed record in your Lambda function:
return { batchItemFailures: [ { itemIdentifier: record.kinesis.sequenceNumber } ] }
Doing so allows you to avoid unnecessary reprocessing of the records that were already successfully processed. The ESM will do the retries only for the part that hasn’t been processed yet, starting from the record that caused the failure. I told you, that sequence number can be very handy! 🙂
If all else fails, the ESM also allows you to set an on-failure destination (SQS or SNS) for the records that cannot be processed after all the retries. Lambda will then send some metadata about the failed batch to this destination (not the batch itself). In that way, you could retrieve the records from the stream later, as long as they do not expire.
One thing to note here is that you can not use Lambda’s own retry and DLQ settings because they are meant only for asynchronous Lambda invocations and, as we have learned, the ESM invokes a Lambda function synchronously.
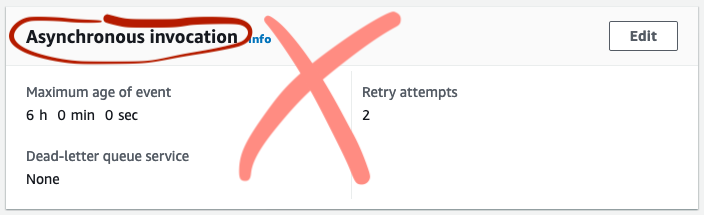
Instead, you need to configure the on-failure destination and other error handling settings on the event source mapping when defining your function trigger.
Why bad things happen to good streams
Now we know how to deal with errors in the Lambda function itself. But how about system errors? Why do they happen in the first place and should we do something about them as well?
Up until now, we have only been concentrating on what happens after the ESM gets a batch of records from a stream. But we haven’t talked much about how exactly the ESM gets those batches. The thing is, it depends on whether you are using a shared or a dedicated throughput consumer. To better understand what is happening behind the scenes, let’s compare how Lambda service and the ESM behave in both these scenarios.
Shared throughput
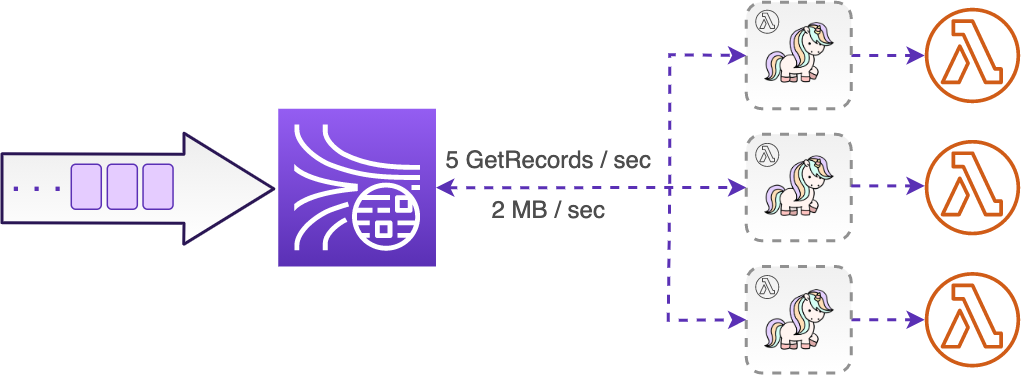
As briefly mentioned before, the shared throughput consumers (also known as the standard iterator) use the HTTP to poll records from the stream. What this actually means in the case of Lambda is that the ESM polls the shards behind the scenes, using the Kinesis GetRecords API calls.
An important detail to note here is that no matter what your batch window or size is, or whether you have a parallelization factor configured or not, the ESM will do the polling at the steady rate of exactly one GetRecords call per second for each shard in your stream. Your Lambda function may of course be invoked more often than once per second per shard (if the configured batch size is reached earlier), but under the hood, the ESM will use the records it has buffered with the previous GetRecords calls. This also means that the records your Lambda function gets can be as much as one second old (that is, the record propagation latency is 1 second).
The GetRecords API comes with some important limits we haven’t discussed yet. First of all, there is a limit on how much data can a single GetRecords call retrieve from a shard (either 10 000 records or 10 MB, whichever comes first). The good thing is in the case of Lambda, the ESM automatically makes sure this limit is never reached (remember, you can not have a batch larger than 10 000 records).
The other and the somewhat more noticeable limit is that there can be at most 5 GetRecords calls made per second in each shard. Once again, the good thing is that this is already taken care of by the ESM that only polls the shards once per second. However, this limit also means that you can have at most 5 different consumers using the shared throughput before they start to get throttled.
When throttling (or other intermittent error) happens with Lambda service, the ESM steps in and handles this behind the scenes with some built-in retries and exponential backoffs. Note that the maximum record age you set for the ESM also applies in this case, and older records will not be sent to your Lambda function. Although the records are likely to get processed eventually, the retries will slow down your stream consumption and may lead to records expiring from the stream over time.
All this means that while technically there’s no limit on how many Lambda functions you can attach to a single stream when using the shared throughput, in reality
- the 5 GetRecords call limit means you can have at most 5 consumers before they start to get throttled, and
- the 2 MB throughput limit means you might start getting behind your stream if you have more than 2 consumers.
The 5 GetRecords request limit also means that the records can be read from the stream once every 200 milliseconds (1 000 ms / 5 calls). This is why the average propagation latency for a shared throughput consumer is estimated at roughly 200 ms. This is also the reason, why adding more consumers means increasing the propagation latency to up to 1 second.
All this explains why enhanced fan-out is the way to go when you either need more than 2 to 3 separate consumers reading from your stream or a consistent propagation latency below 200 ms.
Enhanced fan-out
Now, with enhanced fan-out, instead of polling shards for record batches over the HTTP, records are pushed to the ESM by the Kinesis stream itself through a dedicated long-lived HTTP2 connection, as soon as they are available. For that, instead of using the GetRecords API, the ESM uses the SubscribeToShard API.
This is why using enhanced fan-out provides a much lower record propagation latency of about 70 ms on average. Moreover, this latency remains consistent even if you add more enhanced consumers to the stream. This is also why throttling of the GetRecords calls is not an issue anymore.
Of course, as with the shared throughput consumers, there are other transient internal errors that might happen while the ESM tries to read records using the dedicated throughput. However, they are once again taken care of by the ESM, so you probably won’t ever know they are there.
In the end, after the ESM obtains records from a shard, it all looks the same to your Lambda function. It just gets invoked synchronously, is given a batch of records to process, and does not really care how that batch got there, so to speak.
What do we do, then?
So, now we know why some of the system errors might happen. What comes to the second part of the question (“should we do something about them?”), the short answer is: probably not 🙂
Unless you have too many consumers sharing the throughput, the chances are, you are hardly going to notice any system errors at all. It will all be taken care of by the magic of the ESM.
And now that you know what exactly is happening behind the scenes, this will hopefully help you choose between using shared throughput and enhanced fan-out.
Lambda concurrency limit
One last word about the things that might go wrong with Lambda. And this one is once again about the limits (because let’s face it, there are always limits 🙂).
Though Lambda is a service that can scale massively, concurrent Lambda executions is a limited resource. By default, you can only have up to 1 000 concurrent Lambda executions in the same region for one account. And though it’s a “soft limit” that you can increase by contacting AWS support, there still is going to be a limit. And once that limit is reached, all the new Lambda executions in the same account will be throttled.
We have learned by now that in the case of Lambda as a stream consumer, with just a single consumer application there might be up to 10 times as many concurrent Lambda executions as we have shards in our stream. Imagine having a stream with 100 shards and a parallelization factor of 10, and you get 1 000 Lambda executions reading from your stream at all times.
This means that some of your other, possibly business-critical Lambda functions might get throttled and stop working because your stream consumer takes up the entire Lambda “budget” for the account/region.
A very special window
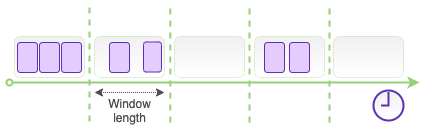
To finally close our Lambda chapter, there is one more, new trick the ESM has under its sleeve that I want to share with you. Though it is just another configuration, not unlike the parallelization factor, for instance, this one is quite different in nature. It is called a tumbling window.
Tumbling windows are simply consecutive time intervals of a fixed length that do not overlap. Each window has a clear start and end time. Each record in each shard will end up in exactly one such tumbling window, based on its value of the approximateArrivalTimestamp.
Why are those windows so special, you may ask? Tumbling window configuration allows you to do something that would otherwise require the use of an external database or a data store: it allows you to retain the state of your Lambda function between invocations.
The state will be retained only within the same shard and only for the length of one such tumbling window (which can be configured to anywhere between 1 second and 15 minutes). But within that time window, you can aggregate processing results across multiple Lambda invocations.
Your Lambda function will still be invoked normally, based on the batch size and batch window configurations, but each invocation will only contain the records written to the stream within the given window interval.
When the tumbling window is enabled for the ESM, additional attributes are automatically added to the Lambda function input:
{
  Records: [
  ...
  ],
  shardId: 'shardId-0000:12345',
  eventSourceARN: 'arn:aws:kinesis:eu-west-1:<account_id>:stream/the-best-stream',
  window: { start: '2020-12-17T19:00:00Z', end: '2020-12-17T19:10:00Z' },
  state: { <anything you want to aggregate> },
  isFinalInvokeForWindow: false,
  isWindowTerminatedEarly: false
}
These new attributes include:
- the current window start and end time (in this example we have a 10-minute long window),
- the attribute indicating whether this is the last Lambda invocation within the current window or more are still to come (isFinalInvokeForWindow) and, finally,
- the state itself, which can be anything you want to aggregate, as long as it remains within the limits of 1 MB. The state is reset to an empty object before the first Lambda invocation in every tumbling window.
In your Lambda function, you simply access the state attribute from the input event, make the aggregations you want, and pass the new state forward by returning it from your function:
const newState = event.state
// do smth with the state
return { state: newState }
This state will then be passed to the next Lambda invocation within that tumbling window.
The isFinalInvokeForWindow attribute is set to true in the very last invocation of each tumbling window. This helps you to determine when to process the results of the window aggregation. You could, for example, store those results in a database, or send them to a queue, or maybe even another Kinesis stream!
if (event.isFinalInvokeForWindow) {
  // do smth very cool with the results of the aggregation!
  console.log('This is what we have aggregated in this window:', event.state)
}
The next tumbling window will start afresh:
{
  ...
  window: { start: '2020-12-17T19:10:00Z', end: '2020-12-17T19:20:00Z' },
  state: {},
  isFinalInvokeForWindow: false,
  ...
}
Tumbling windows allow performing near real-time analytics on your streaming data, similarly to what Kinesis Data Analytics can do. However, unlike Kinesis Analytics, the aggregates are performed only within a single shard, not across the entire stream.
You are not allowed to have concurrent batch processing with parallelization factor if you enable tumbling windows.
A few words on KCL
I mentioned in the beginning that Kinesis Consumer Library or KCL can be used to create custom consumer applications.
Just like Kinesis Producer Library, or the KPL, KCL adds another layer of abstraction over Kinesis API calls. While the situation with supported languages is a bit better than with KPL, you will still need a separate Java-based daemon running in the background at all times.
An interesting detail here is that KCL uses a DynamoDB table to keep track of the shards and to “know” where in the stream to read from at any given moment. This DynamoDB table is created automatically when starting up your KCL application and it has a throughput of 10 reads and writes per second. Naturally, you will be charged for this table.
There is also another gotcha here: if you add more shards to your stream to accommodate the increased amount of data, you are running a high risk of exceeding the DynamoDB table’s throughput and getting throttled. This might take you by surprise while you didn’t even create any tables in the first place! Of course, once you know it’s there, you can add more capacity to the table if needed.
Monitoring
We have once again reached the point in our story where there has been an extensive discussion about all those things that can go wrong. Let’s now discuss monitoring. In Part 1 we already went through some general considerations about CloudWatch metrics for Kinesis Streams, as well as the metrics relevant to writing to a stream. Now let’s take a look at the most helpful metrics when consuming a Kinesis stream.
Records getting older
The single most important thing to know about the wellbeing of your stream is the “age” of the records in it. This is the amount of time between the current moment and the moment when the records were written to the stream.
In the case of the shared throughput consumers, there is a metric that tells you just that:
- GetRecords.IteratorAgeMilliseconds: The age of the last obtained record, in milliseconds. Note that this is a combined metric that tracks all the consumers of the stream that use the shared throughput. Also note, that this metric will mostly remain on 0, which means that consumers are caught up with the stream.
Occasional spikes in the iterator age are usually nothing to worry about. They might be caused by occasional spikes in traffic or, possibly, retries in your consumers.
However, if the metric starts to grow over time, it can mean that the data is being written to the stream faster than it can be consumed. As we know by now, in the worst-case scenario, if the iterator age gets close to the stream’s retention period, there is a risk to end up in the familiar overflowing sink situation. Your consumers won’t have enough time to process the records before they are deleted from the stream and lost forever.
Being a combination metric, GetRecords.IteratorAgeMilliseconds alone might not be very informative if you have several stream consumers or if you are using enhanced fan-out. Luckily, if you use Lambda functions as your stream consumers, each of these functions comes with its own IteratorAge metric that tells you precisely which consumer is causing the stream’s iterator age to grow. Unlike the stream’s combination metric, Lambda’s IteratorAge also reflects the age of the records retrieved by enhanced fan-out consumers.
- IteratorAge: the age of the latest record the ESM reads. Unlike the stream’s metric, this one reflects the actual latencies and is expected to have a value greater than 0.
Reaching the limit
Another metric that you need to keep a close eye on is directly related to the shared throughput limits:
- ReadProvisionedThroughputExceeded: The number of GetRecords calls (not individual records) throttled for the stream. This combines errors from both, trying to read more than 2 MB of data per second and exceeding one of the GetRecords API call limits.
In the case of Lambda functions consuming a stream, occasional throttling does not necessarily mean that you are in trouble, while the ESM takes care of retrying throttled requests on your behalf. Unless throttling is accompanied by the continuous increase in the iterator age.
There are also other very informative metrics that will help you diagnose your stream condition even further. However, you would usually need to examine them only when one of the metrics above indicates you have a problem.
Finally, there’s the Lambda concurrency metric
- ConcurrentExecutions: The number of active Lambda instances, across all functions in your account, in the given region.
As we discussed previously, Lambda concurrency limit is one of those limits that may have a larger blast radius and more negative impact than it may initially seem. So, it is always recommended to keep a close eye on this metric.
Pricing model
I will end our story once again with a discussion about money.
The main pricing model for Kinesis Streams was already discussed in Part 1. Here I will only summarise the possible extra costs associated with consuming data from a stream:
- Using enhanced fan-out: while reading data with the shared throughput will normally cost you nothing, you will be charged for using enhanced fan-out. You will have to pay for each GB of consumed data, as well as for each enhanced consumer, on a shard per hour basis.
- If you want to read data older than 7 days (long-term retention data) using the shared throughput, you will have to pay for the amount of that data you consume. However, there are no extra costs if you are using enhanced fan-out.
- DynamoDB charges when using KCL: you will have to pay for the automatically created table as you normally would with DynamoDB. If the stream has a large enough amount of shards to require a high-throughout table, DynamoDB costs might start to get more noticeable.
Conclusions
In a nutshell, there are two distinct ways to consume a Kinesis stream: the standard iterator and enhanced fan-out. You can also call them shared and dedicated throughput, while that’s exactly what they are. Shared throughput will cost you nothing, but you can only have 2-3 consumers, and it might take up to one second from the moment the data is written to the stream to when it is consumed.
While this might be all that you need most of the time, you also have other options. You will have to pay for each of your dedicated throughput consumers. But in return, you will get up to 20 consumers with a near real-time record propagation latency.
Direct service integrations can only share the throughput with other consumers, and you can mix and match these two options to get up to 22-23 distinct stream consumers.

We have covered a lot of ground here! I want to leave you with a “cheat sheet” containing some key takeaways that I hope will serve you both as a summary and as a future point of reference.
Lambda and the ESM:
When using Lambda as the stream consumer, it is the part of the Lambda service called the event source mapping that handles reading, batching, and retries for you. It allows you to configure:
- Batch size (1 to 10 000)
- Batch window (1 sec to 5 min)
- Concurrent batches per shard, aka parallelization factor (1 to 10)
- Tumbling window for analytics (1 sec to 15 min)
Regardless of those configurations, under the hood, the ESM will either poll each shard once per second using the GetRecords API (shared throughput) or get records continuously pushed by the stream through the HTTP2 instead (enhanced fan-out).
Failures:
As always, you need to have proper error handling implemented in your function, but you should also leverage the error handling possibilities provided by the Lambda service itself:
- Max retry attempts (up to 10 000)
- Max age of records (1 min to 7 days)
- Batch bisecting
- Returning partial success
- On-failure destination (SQS or SNS)
Important limits:
There are several limits that you need to be aware of when consuming a Kinesis stream.
For shared throughput consumers:
- 2 MB of outgoing data per second per shard
- 5 GetRecords API calls per second per shard
- 10 000 records or 10 MB per one GetRecords call
For enhanced fan-out consumers:
- 2 MB of outgoing data per second per shard per consumer
- 20 consumers per stream (limit for the RegisterStreamConsumer API)
For any Lambda consumer:
- Lambda synchronous payload limit: 6 MB
- Lambda concurrency limit: 1000 / account / region by default
Important metrics:
The most valuable metrics when reading from a stream:
- GetRecords.IteratorAgeMilliseconds (shared throughput consumers)
- IteratorAge (Lambda function)
- ReadProvisionedThroughputExceeded (shared throughput consumers)
- Bonus: Lambda ConcurrentExecutions
Once again, keep in mind that CloudWatch metrics are per minute, while most stream limits are per second.
And one more bonus (I promise, this is the last one 🙂),
Troubleshooting:
If your stream’s iterator age is growing, it’s likely because either:
- you have more than 2-3 consumers that share the throughout
- use enhanced fan-out instead
or
- you write data faster than it can be consumed
- add more shards or (better) increase Lambda parallelization factor
- tune your Lambda function to process the batches faster (for example, add more memory)
- increase Lambda concurrency limit for the account, if your Lambda is throttling
If you are consistently seeing ReadProvisionedThroughputExceeded, it’s likely because:
- you have more than 2-3 consumers that share the throughout and exceed one of the stream limits
- use enhanced fan-out
- you might have “overheated” shards that cause exceeding the stream limits
- enable shard level “enhanced” metrics, discussed in Part 1
- make partition keys as random as possible to evenly distribute records in the stream
And with that, it is officially the end of my two-part saga about Kinesis Streams! Of course, there is more to it than I could fit into two posts, even as huge as these ones. That being said, by now you should have a solid understanding of this essential and very useful service.
Are you already using Kinesis Streams? I hope you learned something valuable! Are you new to Kinesis Streams? I hope this will encourage you to consider using it next time you deal with streaming data and service integration.
As Werner Vogels would say: now go build! 😉