Running software that provides a service is a very easy task for the first few months. After it has been freshly written and carefully tested and works fine with the latest up-to-date frameworks. Running a system of applications with integrations between them, written with a multitude of technologies on a multitude of platforms during the last few decades where every failure can affect another application - that’s a different beast. And of course, even those fine state-of-the-art applications become legacy over time, while business and technologies keep on changing around them but the code is not updated to reflect those changes.
As a Software Architect in Solita, I’ve mostly been involved in creating new software solutions. Sometimes customer-facing applications, recently more and more components or systems that deal with data. Collecting data, analyzing data, refining data, and finally using that insight. Sometimes I get to do both. And sometimes I’m also called to help to stabilize a provided service that’s not 100% reliable.
As I mentioned, when writing something anew that solution gets a lot of love and testing, and using modern tools and frameworks, many things are already taken care of. But if one of its legacy dependencies fails, it might cause a cascading effect, and the result is that service goes down, or is not working properly. Which means loss of data, customers, business, credibility, money, in many cases.
So it would be fun to try and stop that.
Then we need to take a bit larger view of things. It’s not anymore about watching logs of a single modern application. We need to monitor all the things that can fail that contribute to running that service. The priority is to get some visibility to begin with.
Turn on the headlights
So, well-behaving applications have logging, preferably logging that can be controlled, at least how much is getting logged, and where it’s getting stored. But sometimes errors are not visible in logs at all, for example, the whole application crashing or getting stuck. Or CPU going over 100% or running out of memory. Or logging component having some problems. Or invalid configuration having snuck in. So perhaps we need to monitor many things? And monitor the monitoring? And how about when we run serverless?
Both on-premise and modern cloud platforms offer many ways to tap into those metrics. Someone just has to do it. The problem is not that we would not have enough metrics. For example, AWS Cloudwatch has a crazy amount of technical metrics and details you could see and play with. But adding metrics does not necessarily increase happiness. It might cause information overflow, having a hundred lights and numbers blinking on and off constantly. Making whoever is operating the application need to combine meaningful information from all these metrics to conclude if the service is working or not.
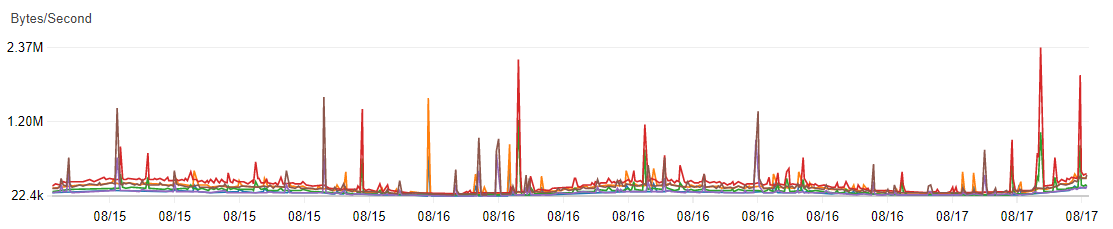
But when starting to build in the observability, or adding monitoring on top of an existing application, it’s not too bad to just visualize anything you can easily access. Observing those for a bit lets you understand what metrics react to changes and problems and which ones do not. It’s just important to stop adding more metrics every week. A dashboard with 100 detailed graphs to read can be difficult to understand. Like with a good quality code you love - less is more. Sometimes you need to remove to increase value. That brings us to the next point.
Distill the wisdom
Now we get to the good part of this article. To make those real-time metrics useful, we need to find the meaningful ones, perhaps combine them, to create two levels of visibility. The first level questions: Is everything okay, or is something wrong? The second level offers tools for analyzing things when they are not okay. We want to find the root cause so that we can fix it.
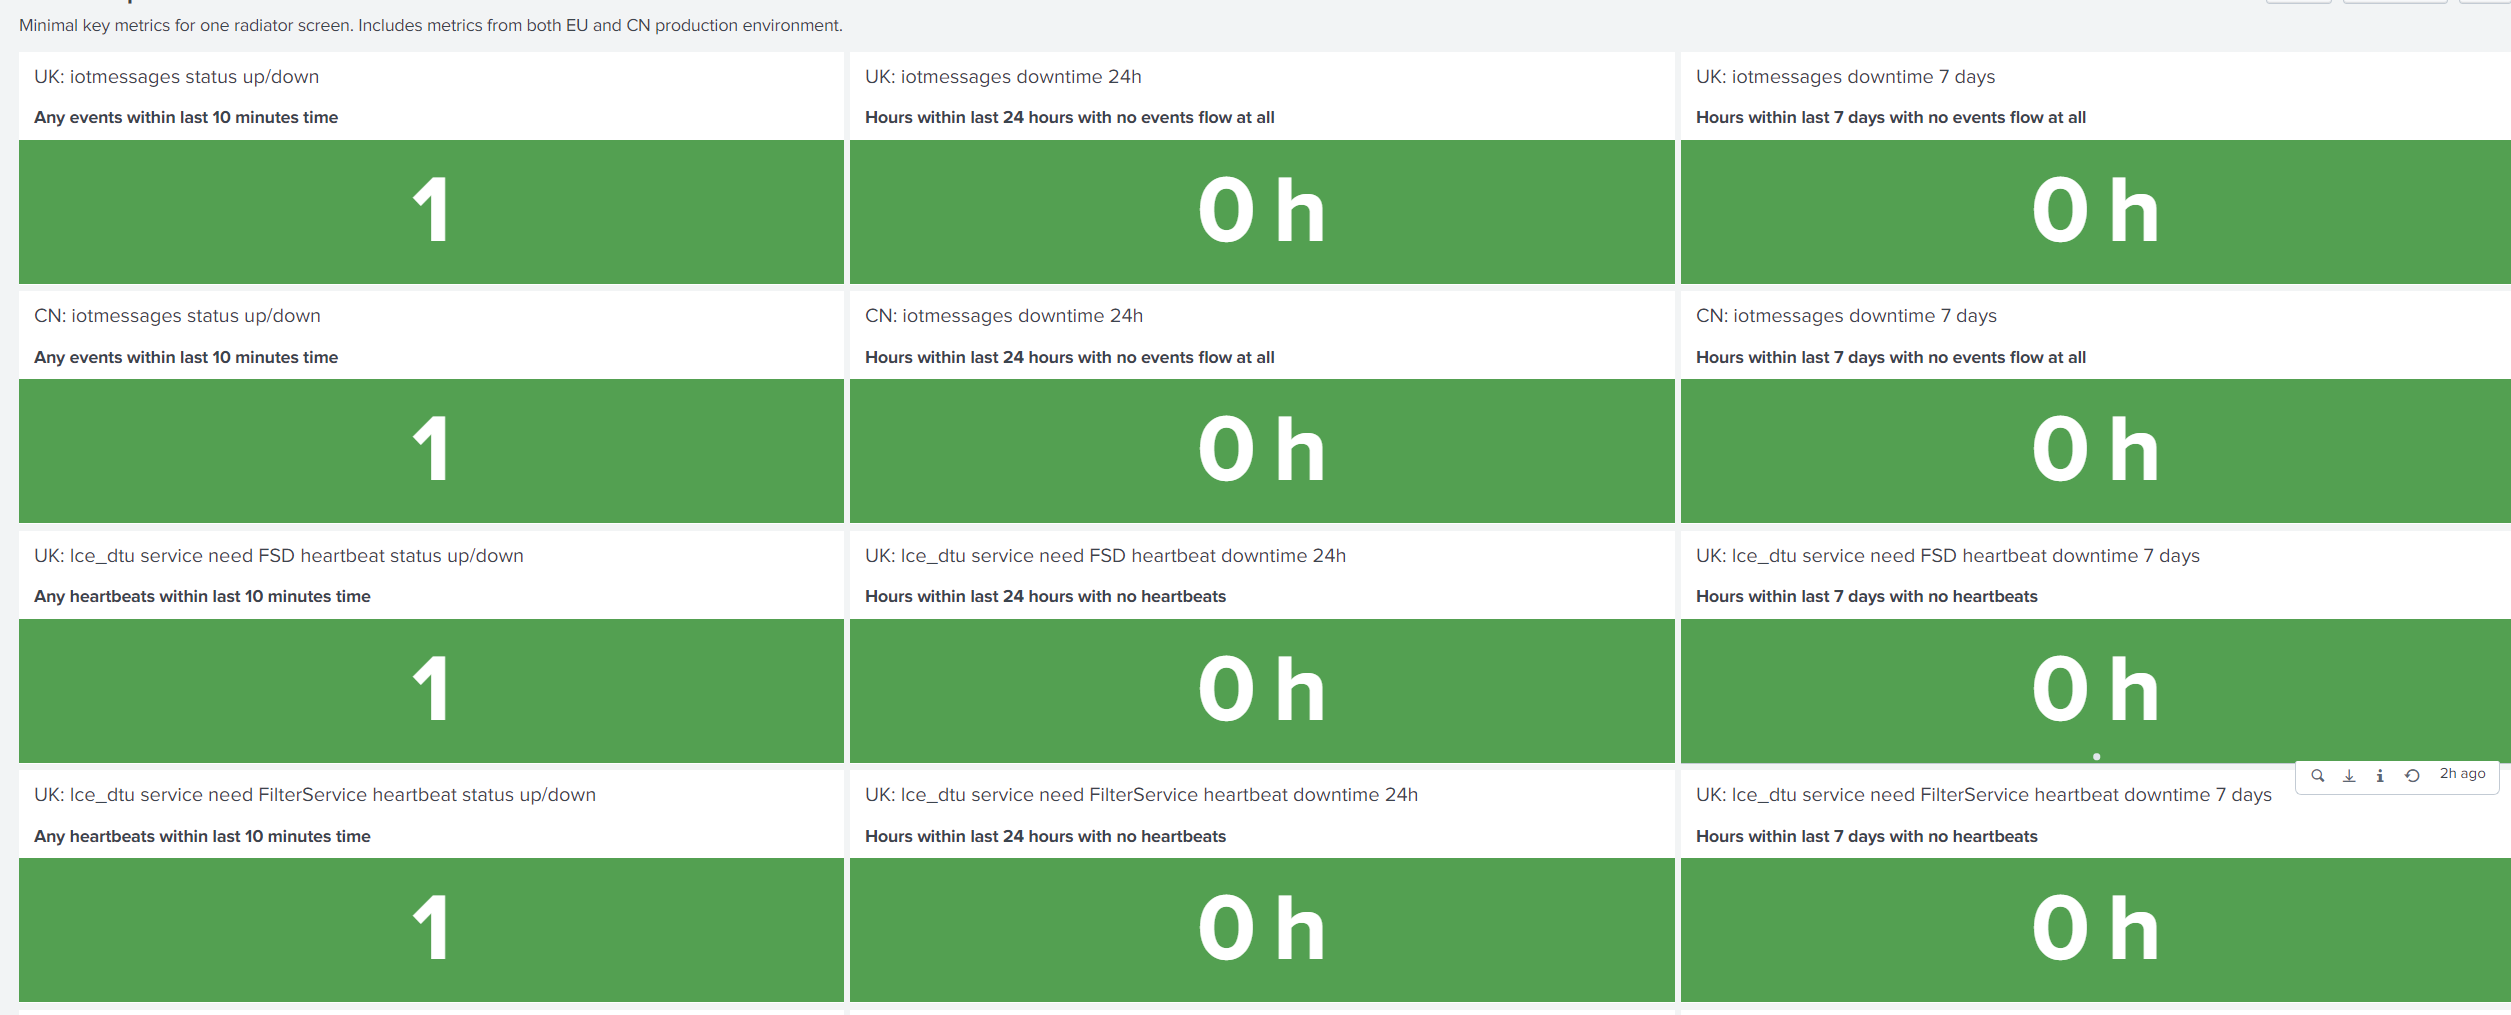
This requires raising the abstraction a bit, typically to a more business-oriented direction. We’re not hunting for every error in the logs, they are not equal, especially with systems that can self-heal from many errors or recover from network hiccups. Using a lot of memory or CPU might not be so interesting either, depending on the situation, it might be entirely normal behavior to use a lot of resources, especially under stress. So we want to find a level more related to business needs. To do that we have a few questions:
- What the application should be doing when it’s properly working?
- How can we observe that? And where?
- How is the application behaving when it’s not working? What are the symptoms?
If you are simply chasing any errors or anomalies in the metrics, they might not indicate anything severe enough to warrant any actions. The best bang for your buck might be to find some metrics that indicate success. Then measure that it’s on acceptable levels. If that metric is good enough, it will automatically include any severe errors.
For example, is the throughput on expected levels? Are pages loading fast enough? Are we having an expected level of traffic? Are we getting enough data? You can take it even higher level by having a metric like orders per hour, or similar business level requirement. If you can measure the metric end-to-end, catching that single one will let you see a multitude of different error scenarios that might happen to disrupt it. For example, running out of disk space due to log files, one dependant system with no monitoring crashing, anything that would affect those metrics.
That familiar loop…
So, if we were in a very static world, this would be simple. We would just build the perfect dashboards and alarms, and things would eternally work. Unfortunately, that is not often the case. More typically, business requirements keep on changing and expanding. Technical requirements and possibilities keep on branching out. New systems and tools are being introduced as a result. So those excellent dashboards and alarms that you just created, are now obsolete. New types of errors are introduced that are invisible.
So that’s where DevOps comes in. You build it, you run it. This model also works in a more traditional environment, with separate ops. Mainly we just need someone to be responsible for the observability and to have resources to maintain it when things change. And here’s an idea how. Let me introduce an iterative process for incident response. Sorry, there’s no sexy acronym for this, it’s just a model I’ve come up with and used successfully a few times.
This model will eat incidents, symptoms that something is wrong. And it will output iterative improvements, constantly making the environment more robust, and people working on it happier. Hei, since I invented this, I can make up an acronym. How about AIRM - Agile Incident Response Model? :)
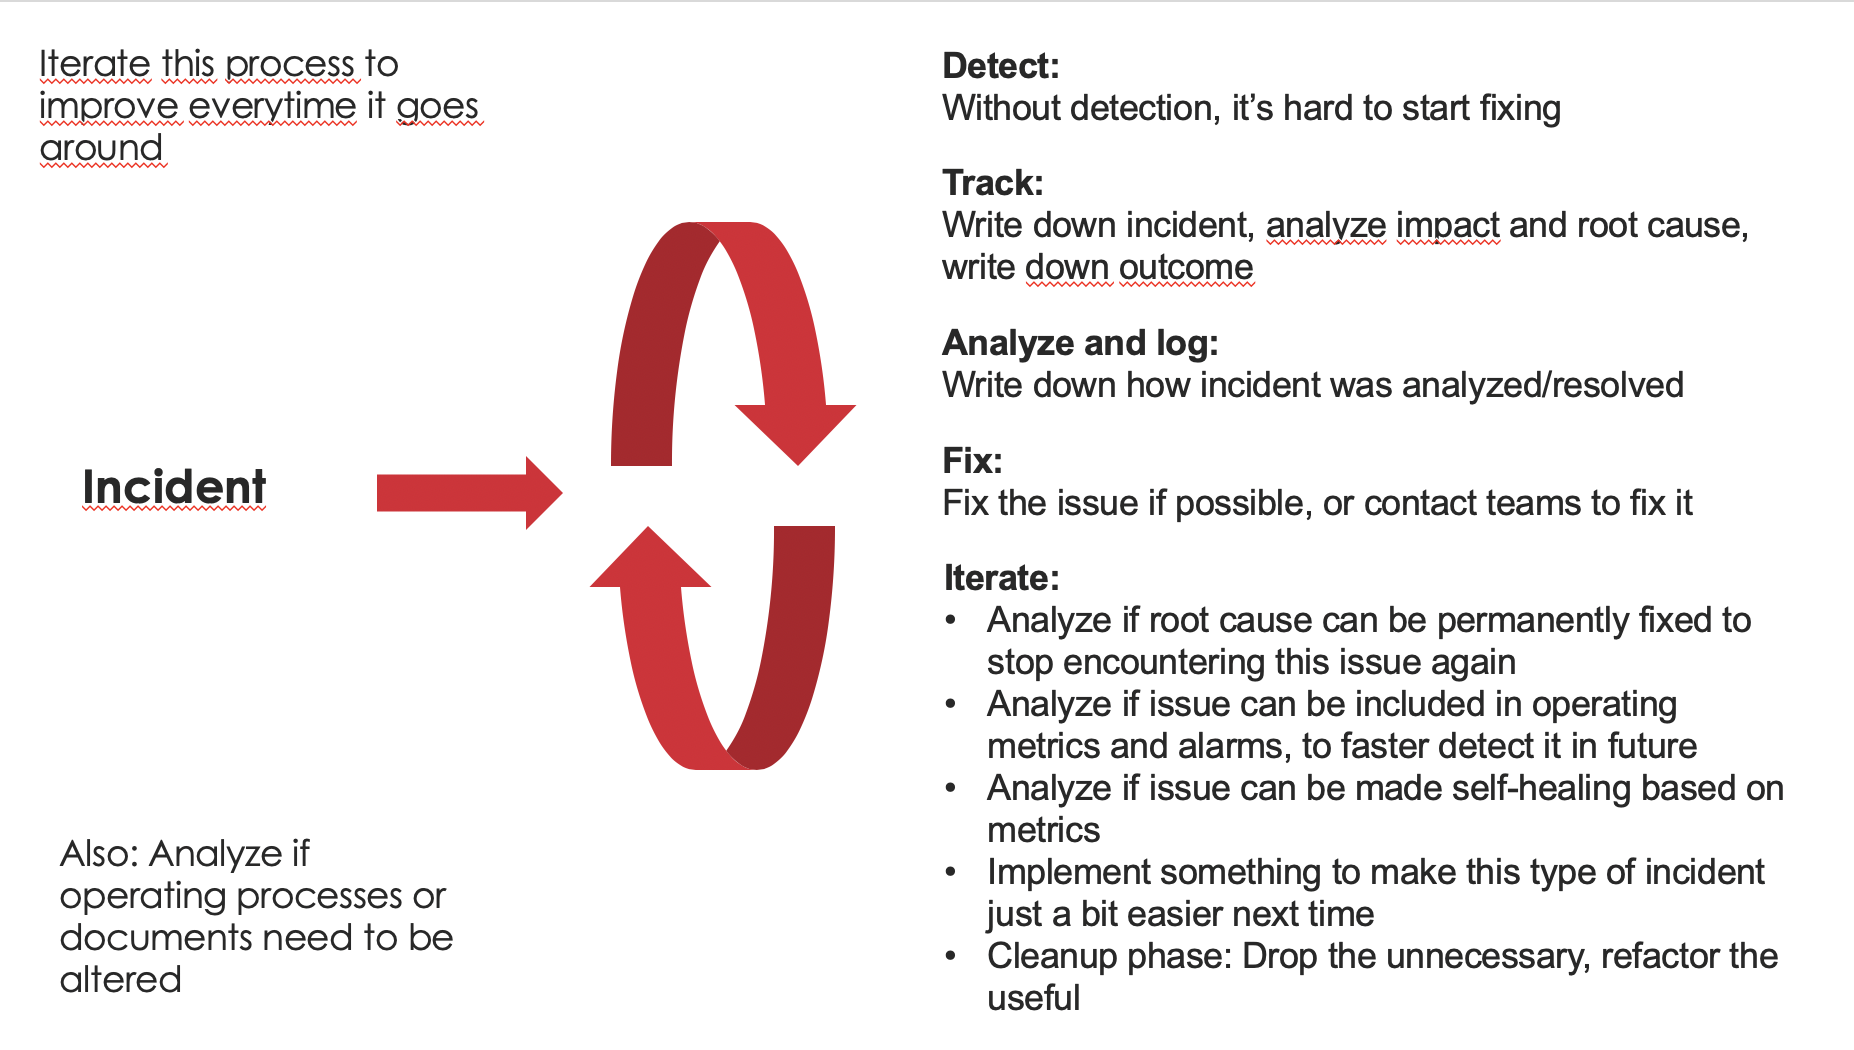
So, the input for the process is an incident. Incident is any symptom that something is going wrong. It might be a red light on a dashboard or alarm going off. It might also be observed anomaly not seen before with no clear indicators existing. It might be, as a worst-case scenario, an angry phone call or email that eventually reaches you when something is not working as it should be. For a DevOps team, you could also define it as something exceptional that breaks the normal development flow, and forces you to take some action.
Once we have an incident, we want to verify it, to avoid unnecessary work. Then we want to analyze it, to understand the root cause and impact and severity. At this point, it’s also good to understand if it’s an old, known issue, or a new one that requires more work to understand. Depending on the model then you notify the interested parties or start fixing it yourself. You want to track that it gets a resolution. And then comes the magic part.
While instinct is saying these interruptions are nasty, and you wish to fix it and move onwards rapidly - they are excellent opportunities for learning and improving. So at this point what you want to do is a bit of retrospective or postmortem.
- How did we detect this? Can we improve this?
- Was it a known problem or a new one? Can we see this faster and better in the future?
- How fast did we react? Were there big delays from detection to resolution? How can we improve that the next time we see this problem?
- Should we implement some improvements, to be faster and better next time? Do we need more metrics, alarms, or self-healing capabilities, or better diagnosis tools?
- Whatever you do, leave a trace/log of incidents, analysis, fixes, and improvements, and try include in each cycle improvement to next similar cycle
The lowest level of improvement is to improve the process from detection to fixing. I say lowest because this is still manual work, and will only typically advance when someone is there to do the fixing. For a DevOps team, this would mean engineer-on-call. It can still have much impact to formalize and improve a process to make it more robust, and faster, to remove unnecessary slack. Perhaps improve the documentation on known issues, workarounds, root causes, fixes, etc, to avoid a situation where someone needs to do it cowboy-style - writing a lot of code or clicking a lot of buttons without any instructions.
A better level is then to make the process automatic or semi-automatic. This means introducing self-healing parts of the system, that fix themselves based on the observed change. Or better tools so that if there’s manual work involved, it’s minimal and easy to execute by several people. Running one script or tool or function as opposed to casting dozens of spells in the command-line can be a good semi-automatic way to formalize the process.
Self-healing means for example a server that can boot itself as a response to alarm triggering, which tells of a failure. Or kick up another, healthy node. Or reroute some calls to a backup system. This is a very cool level to be because it allows services to recover 24/7 without even necessarily needing to wake up anybody or take any actions. Of course, need to be very careful with fully autonomous self-healing systems, because if the symptom is not correctly detected, and resolution is not correct, it can do something unexpected. For example, going to a constant reboot cycle. Of course, serverless technologies cannot be rebooted, and typically self-heal automatically, at some point, or platform vendor will be responsible for fixing them. On the other hand, if there’s a rare failure on that level, there might not be much you can do about it.
If the process is not formalized via some kind of automation, there’s always a risk that its quality depends a lot on who is doing it and how much coffee have they had in the morning. And that way attempt to fix things might easily do a lot more harm than the original incident.
Whatever level you aim for, keep an incident log, it will help you see repeating issues, and progress in observability. And if you are working on DevSecOps, it’s Security which nowadays benefits most from an instant response, automated or not.
Jarvis, are you there?
What could be better than good script tools and a DevOps process model that learns? Well, you would still need those, but if you can add a bit of ChatOps in the mix, life might get even sweeter.
Any tools run on a specific laptop, that requires installation, credentials, or specific environment might be unavailable during those hectic moments when a new issue is found, and most team members are on a deserved vacation. Having some alarms, key metrics, and perhaps a few buttons to help with analysis/fixing, available in a suitable chat window can be an effortless way to make things happen faster and with more predictable results.
So I’ve had a nasty habit of creating some chatbots with Slack or Teams webhooks or apps, to have some things easily available. A traditional way to route alarms has been via email, but I’ve seen it sometimes fail, or be delayed, and there’s a big risk that people are using personal emails, which hides problems and work rather than helps with it. With Slack or Teams, when the alarm triggers, we can push some key metrics and tools immediately along with it, and the team can swarm on top of them, figure out and communicate the resolution. If the channels are opened to people outside the core team, it can also serve as extra visibility to health, incidents, and resolutions.
Of course, this needs to be done securely - if third parties with malicious intent would have access to these kinds of tools, it would be a very bad day. On the other hand, typical company Slack/Teams channels already come with a lot of similar bots, that need to be checked as carefully. And of course, the same goes for traditional troubleshooting tools/access/laptops.
Is the heart beating?
Sometimes it can be difficult to find a good positive metric that tells us the system is working. For example, when you have a system that logs when it successfully receives/transforms/outputs data, or a system people are using via a web UI - there might be long periods of nothing happening now and then. This is caused by success metrics being organic, and throughput being lacking. It might be that during a national holiday there’s a period of silence. Or might be that during midnight ours some metric drops to zero for a few hours. And if your key metric to track goes to 0 for multiple hours, how do you know your system is working? How do you separate the organic moments of silence from system failure?
An answer I have successfully used a few times is to introduce a heartbeat. And yes, this is testing in production. But not really chaos testing, which is another fun topic. This means that I generate a pulse that goes through the system, that simulates an actual event, in production. Then I measure it at some point. If it’s regular like a heartbeat, it’s very easy to create an alarm to trigger when it starts pulsating. And again, it can be a very reliable indicator that the whole pipeline or request stack is operating normally. The question here is: Given stimulus, is the system able to produce expected output, regularly?
There are, of course, some gotchas with this, as well, otherwise, everybody would be doing this. First thing is that since you’re testing in production, you probably do need to cut out that signal at some point. For example, if it’s an order or purchase, you probably don’t want to deal with money or real products as a result, every minute. If it’s data, you don’t want it to corrupt or twist the data you are collecting. If it’s a failing IoT device, you don’t want someone to rush to try to fix the invisible device. If you are measuring things, you don’t want to twist the statistics with something that generates proportionally a lot of traffic.
So the principle is: We want it to be as end-to-end as possible to cover as many layers the signal traverses as possible with that single metric. You want it to be as realistic as possible so that it represents well the real signals. But you need to code in some recognition so that systems understand this is a test event, in production, and can dance around it instead of including it. A nice trick is to use a unique namespace of client ids, some special headers, etc, any kind of metadata that lets anyone examine the request or signal, and be able to differentiate them.
Another thing is that heartbeat requires maintenance when things around it change, but fortunately, once it’s been done, this maintenance work often stays quite minimal.
Surfing the chaos
So, I assembled here a short TL;DR for the impatient: Key takeaways from this blog to remember when you are producing systems and services that run in a very robust fashion.
- Turn on the headlights: Start by seeing what visibility you have, and how much you can improve it. It’s very easy to start from missing input, then add alarms for anomalies.
- Distill that wisdom: Instead of having 200 metrics out of which only 20 react to something, perhaps have 5 or 10 metrics that combine things, and are reliable
- Consider also having two tiers: A high-level tier for situational awareness and quick reads, and then analysis tools that give you all the information in the right context
- This is not a project, it’s a process. It needs to evolve as requirements and systems do. DevOps teams can do this very well, but it’s also possible to build this model around traditional dev and ops teams - as long as they can communicate and iterate together.
- Leverage incidents as food for your continuous improvement beast: Always iterate to make things better next time. Instead of seeing incidents as nasty interruptions, embrace them as learning situations. By reacting properly to incidents, we are building our response around things that actually can break, not around things that might theoretically break but never do.
- Heartbeat can be your friend: Artificial stimulus, and alarms on top of key metrics - this can get you a very good insight on if production system is working, without needing to chase individual errors or a multitude of things that may break
- Embrace the incidents and anomalies. Many teams are irritated when something breaks, and try to do a quick and dirty fix to get back to normal flow, even if they need to do it always again manually. True DevOps warriors embrace this as an imput, and opportunity for growth and improvement.
That’s all folks! I wanted to write down some of my learnings, while I still remember them. The first time I applied these with instinct, and they were successful. Now having used these ideas a few times with great success, I was getting confidence that these might be worth sharing. Hopefully useful to You as well!