Introduction
A practical example of predictive machine learning. Targeted for business people who want to harness machine learning for business but also understand how it actually works.
The aim is to demonstrate:
- A concrete example without going too deep in theory.
- The difference between machine learning and reporting.
- Benefits to business.
For those who are interested in technical part, the R code and data is available at the end of the post.
According to a definition machine learning means that a machine can learn without having explicitly programmed for the task. This doesn't mean that the program code would evolve by itself, but different results are produces in different situations depending on the data and the set of rules that are applied.
Machine learning use cases
Let’s quickly see some machine learning use cases.
#1 Predicting by variables
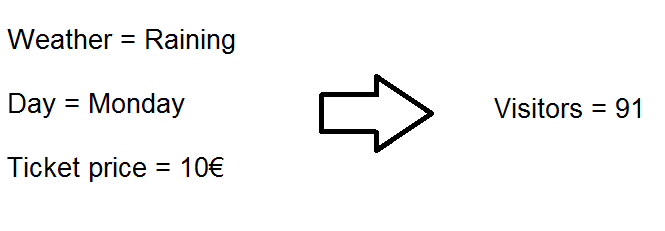
Problem. How to predict the number of visitors in an event?
Simple solution. Calculate the average from past events.
Machine learning solution. Take advantage of known event related variables when predicting number of visitors. These variables might be weather, day of week and ticket price. This makes the prediction more accurate than overall average.
#2 Clustering
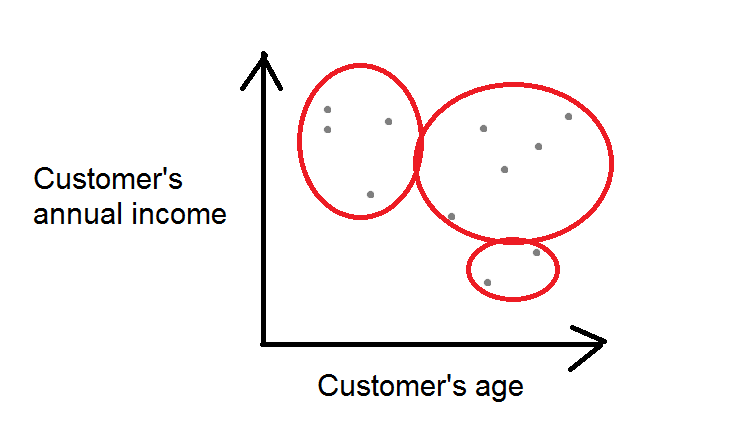
Problem. How to identify customer segments?
Simple solution. Make an educated guess by using fixed values.
Machine learning solution. The algorithm usually needs some initial parameters such as the number of clusters to identify. Segmentation process could be automated and standardized. The segmentation could be run once a day, week or month without any manual work. Another advantage is that there’s no need to set hard limits such as If customer’s annual income is more than 20 000€ and age more than 50, she’s in segment A. The algorithm will set these limits for you.
#3 Image recognition and classification
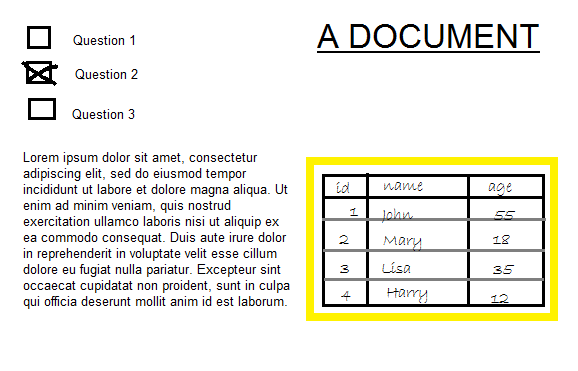
Problem. How to recognize objects, emotions or text from an image?
Simple solution. Do it manually.
Machine learning solution. The algorithm has to be “trained” with already known cases to recognize which kind of pixel and color combinations means certain object. Image recognition could be used to identify data tables from hand written documents to transform the data to digital format. You could also detect other kind of objects such as a human face and take the analysis further by recognizing person’s emotions.
A business problem: Online store deliveries
In the more detailed example, I will go through similar case than the #1: The process of predicting by variables as it is very common scenario in business analytics. Also many of the concepts can be used even in image recognition once the image pixels has been converted to tabular data.
Let’s imagine that we are running an online shop that orders nutrition supplements from a wholesaler and sells the products to consumers.
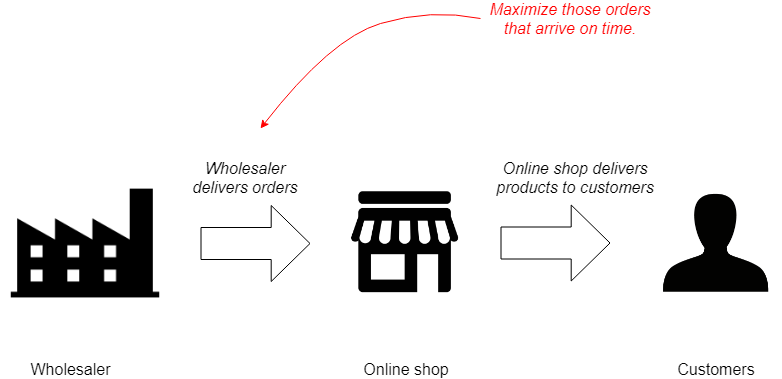
The online store wants to maximize those wholesale orders that will arrive on time. This will increase predictability and end user satisfaction, that will lead to bigger profits.
Sample data
In the sample data a record corresponds to an order made for a wholesaler in the past. The first column is the week when the order has been made (week). Then there are the day of week (order_day), order batch size (order_size), sub contractor delivering the order (sub_contractor) and the info whether the delivery was late or not (is_late).
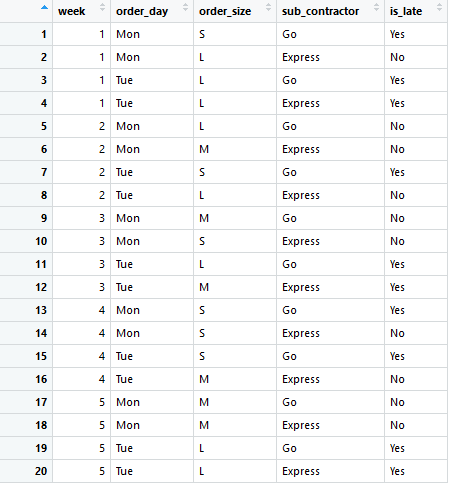
Usually collecting and cleaning the data is by far the most time consuming part. That has been already done in this example, so we can move to analysis. For example, maybe in the original data the size of order was the number of items, but for this case the variable has expressed in S (small), M (medium) or L (large).
There are dozens of predictive machine learning algorithms that work in a different way, but a typical situation is to create a table like this, where the last column is the variable that you want to predict. For historical data the predicted variable is known already. All or part of the other variables are predictor variables.
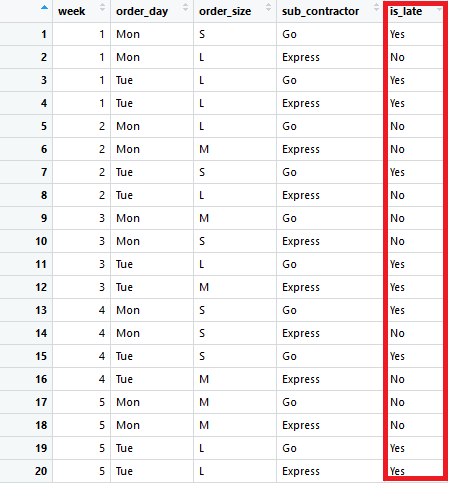
Predicting from reports is not systematic
In traditional reporting you could analyze the rate of late arriving orders from previously introduced 20 rows of data by doing basic data aggregation and see how many percent of orders have arrived late on average for each variable combination.
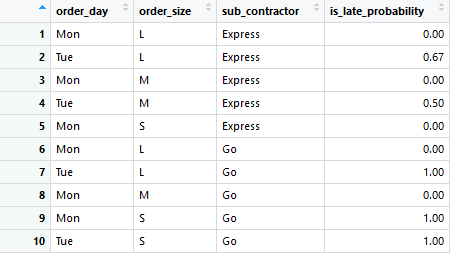
Using reports to forecast future is problematic, however. If there’s only one record for a combination such as Mon, L and Express in row 1, the probability is always 0 or 1, which can’t be true. The summary report also does not handle individual variables (columns) as independent entities, and that’s why there is no way of evaluating probability for previously non existing combinations such as Tue, M and Go.
And the most important part: There’s no way of evaluating how these insights fit into new wholesale orders.
Concept of training and testing in machine learning
The secret of predictive machine learning is to split the process in two phases:
- Training the model
- Testing the model
The purpose is, that after these two stages you should be confident whether your model works for the particular case or not.
For testing and training, the data has to be split in two parts: Training data and testing data. Let’s use a rule of thumb and take 70% of rows for training and 30% for testing. Note, that all the data is historical and thus the actual outcome for all records are known.
First 14 rows (70%) are for model training.
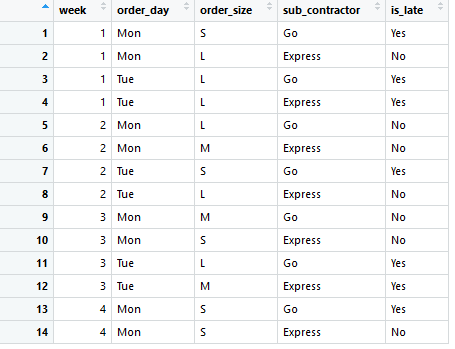
In the training phase the selected algorithm produces a model. Depending on the selected method, the model could be for example:
- An algorithm.
- A formula such as 2x+y+3z-1.
- A lookup table.
- A decision tree.
- Any other kind of data structure.
The important thing is, that the produced model should be something that you can use to make predictions in the testing phase. The situation is very fruitful, as now you can make a prediction for each record in testing data with the model, but you can also see, what was the actual outcome for that observation.
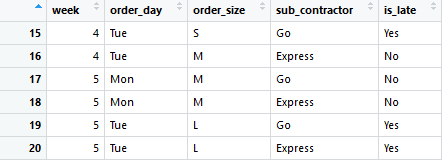
The trained model will be tested with the last 6 rows (30%).
Selecting the machine learning algorithm
Normally you would pre-select multiple algorithms and train a model with each of them. The best performing one could be chosen after the testing phase. For simplicity, I selected just one for this example.
The algorithm is called naive bayesian classifier. I will extract the complicated name to its components.
Naive. The algorithm is naive or “stupid” as it doesn’t take in to account interactions between variables such as order_day and sub_contractor.
Bayesian. A field of statistics named after Thomas Bayes. The expectation is that everything can be predicted from historical observations.
Classifier. The predicted variable is_late is a categorical and not a number.
The naive bayesian classifier algorithm will be used to predict is_late when predictor variables are know beforehand: order_day, order_size and sub_contractor. All variables are expected to be categorical for naive bayes, and that is why it suits to out needs well.
Naive bayes classifier is quite simple algorithm and gives the same result every time when using the same data. It would be possible to explain the logic behind each predictions. In some cases, this is a very valuable.
The week column won’t be used for prediction and its purpose will be explained at the end of the next chapter.
Training and testing the model
Without going too deep in the details, you can run something like this in statistical programming language such as R:
model <- naiveBayes(is_late~order_day+order_size+sub_contractor, data=data.train)
And this kind of data will be stored in computers memory:
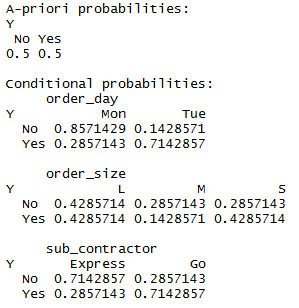
The point is not to learn inside out what these numbers mean, but to understand that this is the model and the software understands how to apply them to make predictions for new orders:
predictions <- predict(model, newdata=data.test)
By doing some copy and paste operations, the predictions can be appended to testing data:

If the value in Yes column is more than 0.5, it means that the prediction for that order is to arrive late.
In our case the order of records matter: The model should be trained with observations that have occurred before the observations in test data. The number of week (`week`) is a helper column to order the data for train and test splitting.
Evaluating the goodness of the model
A good way to evaluate the performance of the model in this example is to calculate how many predictions we got correct. The actual value can be seen from is_late column and the prediction from Prediction column.
Because I had the power to create the data for this example, all 6 predictions were correct. For the second record the probability for both being late and not being late was 50%. If this would have been interpreted as Yes, the prediction would have been incorrect, and the accuracy would have fallen to 83.3% or 5/6.

Evaluating the business benefit
So far we have:
- Identified a business problem.
- Combined and cleaned possibly relevant data.
- Selected a suitable algorithm.
- Trained a model.
- Tested the model with historical data.
- Evaluated the prediction accuracy.
Now it’s time to evaluate the business benefit.
We are confident, that our model is between 83.3% to 100% accurate for unseen observations, where only order day, order size and sub contractor are known before setting up the order. Let’s trust the mid point and say that accuracy is 91.7%.
You can count that in test data 3/6 or 50% of orders arrived late. Supposing that you would have used your trained machine learning model, you could have made the order only for those 3 or 4 deliveries that are predicted to arrive on time and a couple of additional orders that are not described in the test data.
In real world the situation would be more complex, but you get the idea that accuracy of 91.7% is more than 50%. With these numbers you are probably also able to estimate the impact in terms of money.
Implementing the model to daily work
Here are some ways to harness the solution for business.
Data study. Improve company’s process by experimenting the optimal order types.
Calculator. Let employers enter the three predictor variables to a web calculator before placing the order to evaluate the risk of receiving products late.
Automated orders. Embed the calculation as part of the company’s IT infrastructure. The system can make the optimal orders automatically.
As time goes by, more historical orders can be used in training and testing. More data makes the model more reliable.
The model can be trained with the order data from past year once a day for example. Frequent training and limiting data only to latest observations doesn’t make machine literally learn, but rather this adjust the model to give the best guess for the given situation.
Summary
A predictive machine learning model offers a way to see the future with the expectation that the environment remains somewhat unchanged. The business decisions don’t need to be based on hunches and prediction methods can be evaluated systematically.
Thoughtfully chosen machine learning model is able to make optimal choices in routine tasks with much greater accuracy than humans. Machine learning makes it also possible to estimate the monetary impacts of decisions even before the actions has been taken.
Machine learning won’t replace traditional reporting nor it is in conflict with it. It is still valuable to know key performance indicators from past month or year.
Even though there are endless ways to do machine learning, predicting a single variable is a pretty safe place to start.
Data
week,order_day,order_size,sub_contractor,is_late
1,Mon,S,Go,Yes
1,Mon,L,Express,No
1,Tue,L,Go,Yes
1,Tue,L,Express,Yes
2,Mon,L,Go,No
2,Mon,M,Express,No
2,Tue,S,Go,Yes
2,Tue,L,Express,No
3,Mon,M,Go,No
3,Mon,S,Express,No
3,Tue,L,Go,Yes
3,Tue,M,Express,Yes
4,Mon,S,Go,Yes
4,Mon,S,Express,No
4,Tue,S,Go,Yes
4,Tue,M,Express,No
5,Mon,M,Go,No
5,Mon,M,Express,No
5,Tue,L,Go,Yes
5,Tue,L,Express,Yes
R Code
library(e1071)
library(plyr)
library(dplyr)

f.path <- 'C:/Users/user/folder/data.csv'
df <- read.csv(f.path, sep=",")
df

#Make a summery table
df.sum <- df
df.sum$is_late <- ifelse(df.sum$is_late=="Yes",1,0)
agg <- aggregate(df.sum[,'is_late'], list(df.sum$order_day, df.sum$order_size, df.sum$sub_contractor), mean)
names(agg) <- c("order_day","order_size","sub_contractor","is_late_probability")
agg$is_late_probability <- round(agg$is_late_probability,2)
agg

#Split to train and test data
data.train <- df[1:14, ]
data.train
data.test <- df[15:20, ]
data.test

#Count data by order size
table(data.train[1:14, 'order_day'], data.train[1:14, 'is_late'])
table(data.train[1:14, 'order_size'], data.train[1:14, 'is_late'])
table(data.train[1:14, 'sub_contractor'], data.train[1:14, 'is_late'])

#Fit naive bayes model
fit <- naiveBayes(is_late~order_day+order_size+sub_contractor, data=data.train)
fit

#Predict probabilites
probs <- predict(fit, data.test, type = "raw")
probs <- data.frame(probs)
probs

#Get more probable option
Prediction <- ifelse(probs$Yes>0.5,"Yes","No")

#Paste predicted probabilities to original data
data.test.new <- cbind(data.test, probs, Prediction)

#Prediction rate
sum(data.test.new$Prediction == data.test.new$is_late) / nrow(data.test.new)