I have been working with AWS Kinesis Data Streams for several years now, dealing with over 0.5TB of streaming data per day. Rather than telling you about all the reasons why you should use Kinesis Data Streams (plenty is written on that subject), I’ll talk about the things you should know when working with the service. At least it would have saved me some gray hair if I knew those beforehand. So if you are still reading, let’s dive in!

The Kawarau River, South Island, New Zealand, 2017
What is it all about?
Kinesis Data Streams is an essential service in the AWS ecosystem while a lot of AWS own services, such as CloudWatch Events and CloudWatch Logs, IoT Events, and Kinesis Firehose use it under the hood. It is a fully managed and massively scalable service to stream data.
One thing about Kinesis Streams that makes it a very powerful tool, in addition to its nearly endless scalability, is that you can attach custom data consumers to it to process and handle data in any way you prefer, in near real-time.
After writing it to a stream, data is available to read within milliseconds and is safely stored in the stream for at least 24 hours, during which you can “replay” the data as many times as you want. You can increase that time even further and store the data for as long as 365 days, but you will be charged extra for any time over 24h.
Shards
To achieve its massive scalability, Kinesis Streams use a concept called shard. A shard is a unit of parallelism in a stream and you may think of it as an ordered queue within the stream, while the stream is a set of multiple such queues.
A single Kinesis Streams record is limited to a maximum data payload of 1 MB. Each shard, in turn, has a limited capacity of 1 MB/sec or 1000 records/sec of incoming data (whichever limit is hit first) and 2 MB/sec of outgoing data.
When you create a stream, you specify the number of shards you want to have. If the amount of incoming data is larger than your stream can accommodate, you just need to add more shards to it. This is called stream resharding and can be done either through API calls or from the console.
Shards and Partition Keys
Every record you write to the stream ends up in exactly one shard, where it is stored in the same order it was written, until it expires. To decide which shard to put a record to, Kinesis uses a so-called partition key. It’s simply a string that you add to every record you write to the stream, along with your actual data payload. Kinesis calculates an MD5 hash function of that string and, based on this hash value, decides which shard the record goes to. Each shard is “assigned” a range of hash values and those ranges don’t overlap, so each record ends up in exactly one shard.
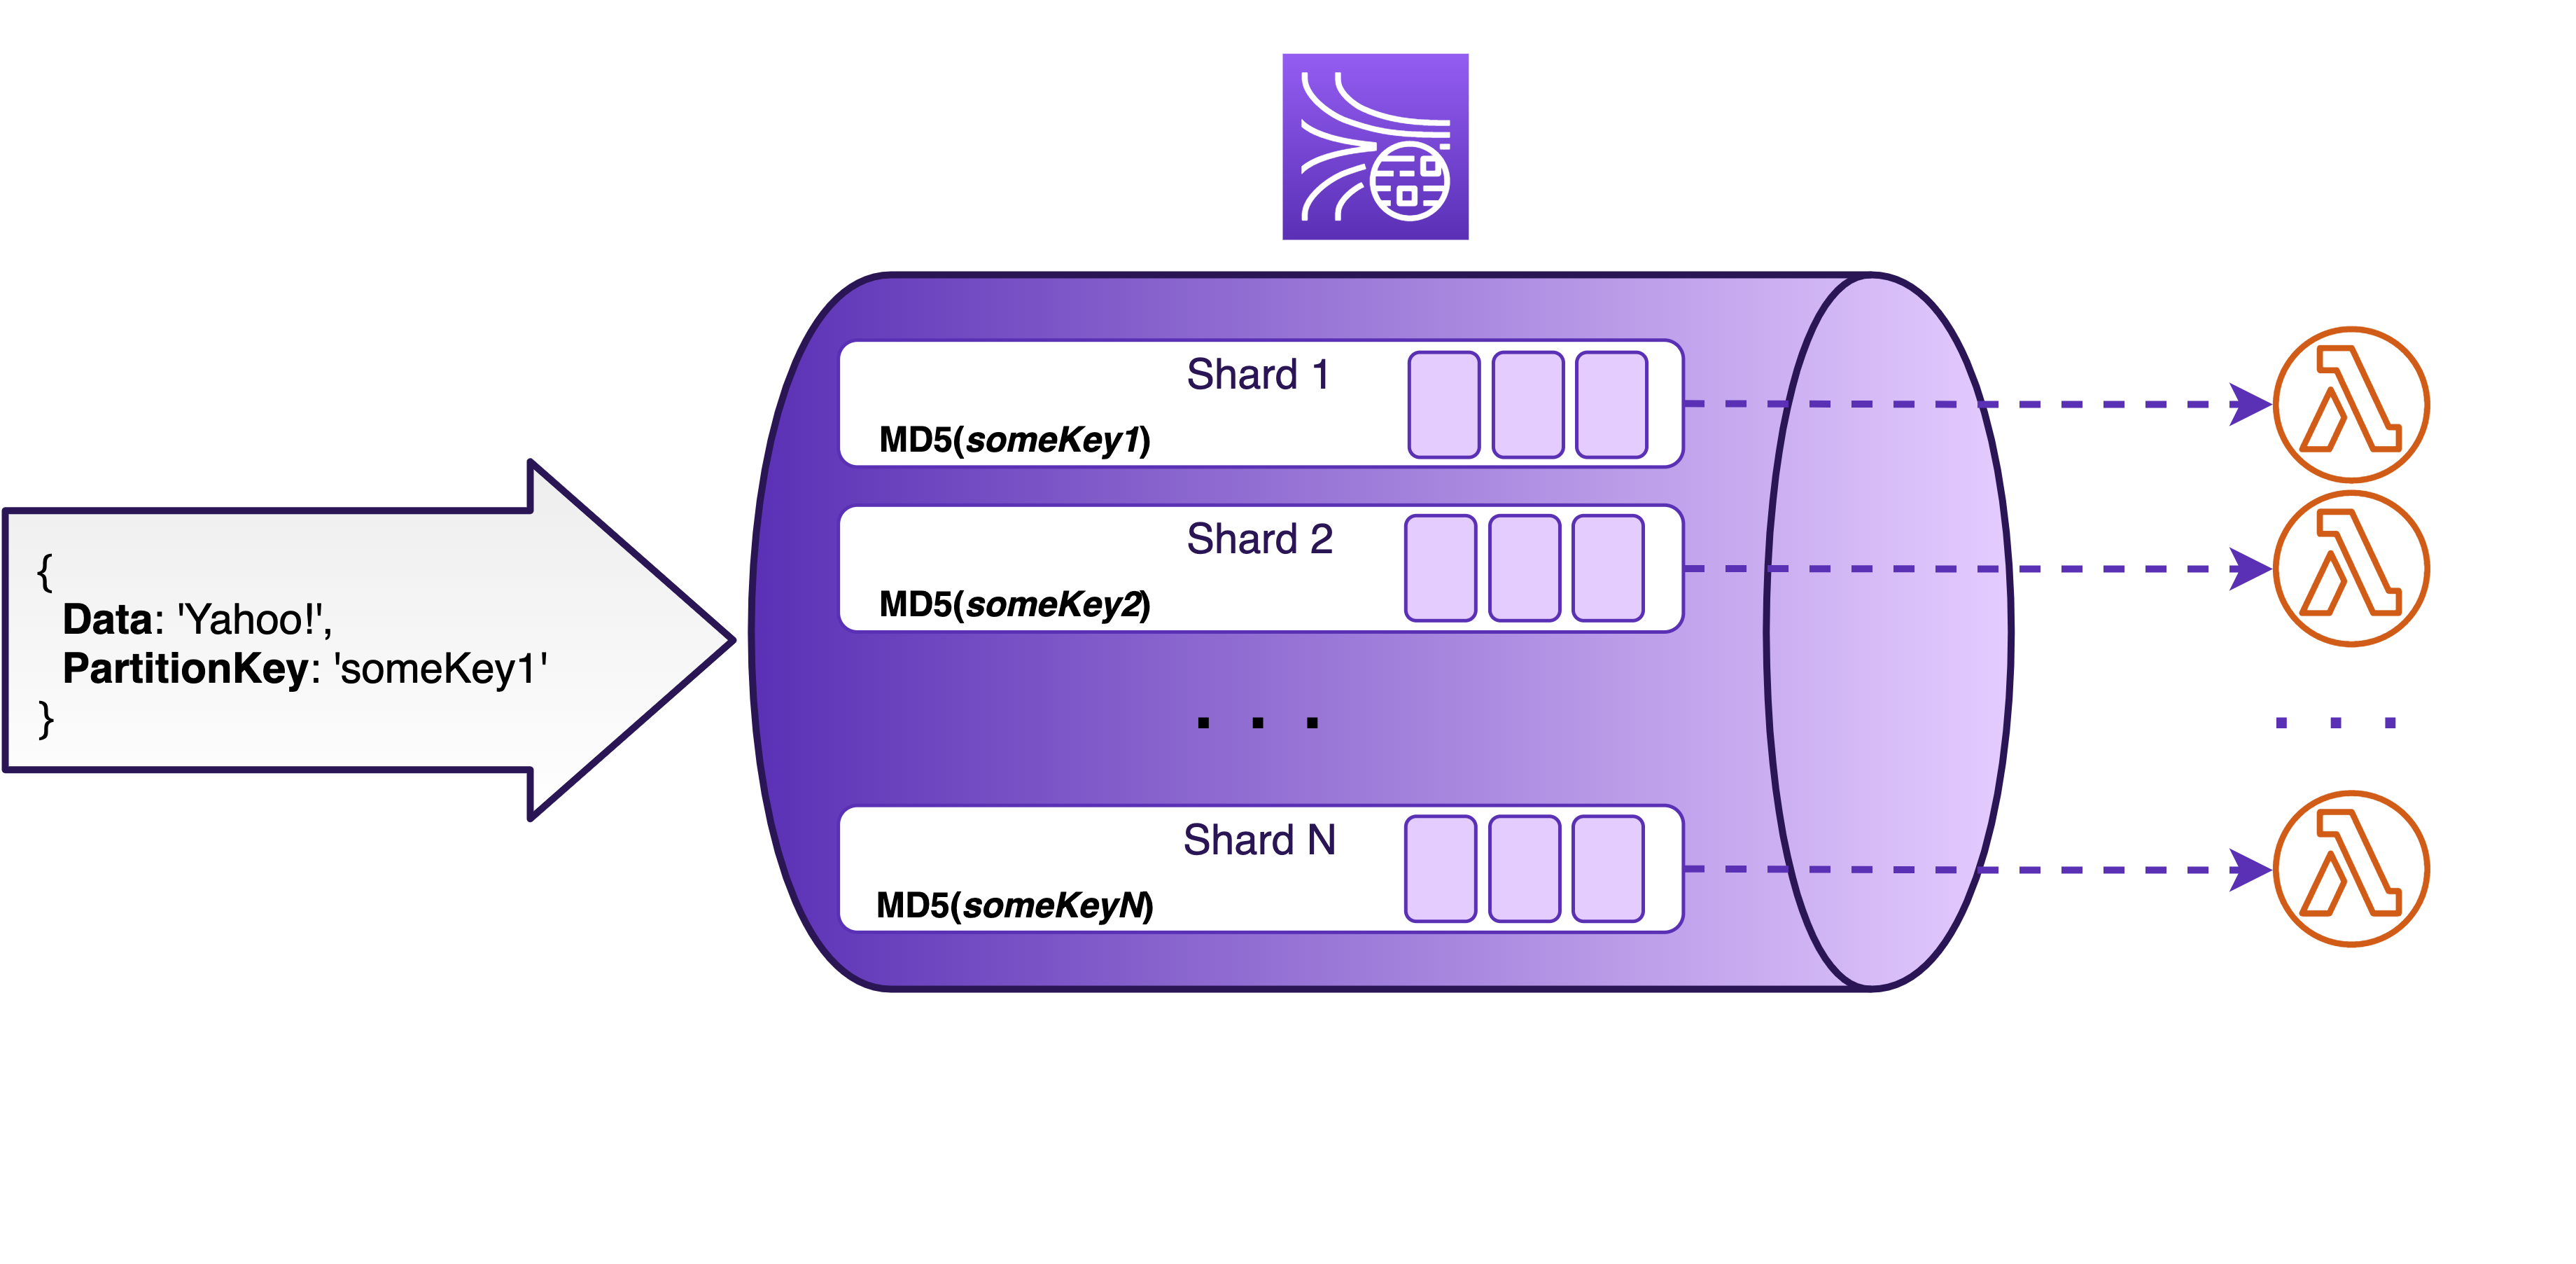
Because the capacity of each shard is limited, it is recommended to use as random of a partition key as possible. In that way, the records will be distributed uniformly across all the shards in your stream, instead of having too many records in a single shard (this is called “overheating” a shard), while other shards remain idle (“cold”).
It’s worth mentioning that while the partition key is not included in the 1MB limit for a single record payload, it is still counted towards the overall size of incoming records when it comes to the shard throughput limit (the 1 MB/sec).
Serverless?
One thing Kinesis Streams is lacking at the moment is built-in autoscaling that would automatically respond to changes in the incoming traffic by resharding the stream. It is possible to implement your own version of “autoscaling” as described in this post. Disclaimer: one would need to use five other AWS services to make this work, so “autoscaling” is really a far-stretched term here IMO 🙂
Why not just add an enormous amount of shards to a stream to accommodate all possible spikes in incoming traffic, you might be asking? You could, but that will cost you. In addition to paying for the amount of data being streamed, every open shard is being charged for on an hourly basis.
Though being fully managed, in a sense, Kinesis Streams is still not entirely serverless. After all, you do need to provision the capacity (shards), pay for that provisioned capacity even if it is not fully utilized and manage the scaling yourself. In a way, it is like DynamoDB in its early days. And like in the case with DynamoDB, I do firmly believe the actual autoscaling is coming, at some point, soon. This, of course, might be just my wishful thinking 🙂
But I digress.
Writing to a stream
So, how do you actually write data to a Kinesis stream? Well, you have plenty of options for that!
You can use the Amazon Kinesis Agent, which is a stand-alone Java application to stream data from files and is useful to e.g. stream your server logs to the cloud. The next option you have is the Amazon Kinesis Producer Library (KPL). It provides a higher level of abstraction over the API calls and has several useful features I’ll be mentioning shortly.
There are also multiple direct AWS service integrations, meaning that many services, such as AWS IoT Core, CloudWatch Logs and Events, and event AWS Database Migration Service can write data directly to a Kinesis stream without you having to write any code (neat, right?). And then there is the API Gateway integration, which is a different beast altogether and which allows you to proxy the Kinesis API calls with some configuration and VTL magic.

For ingesting data from mobile devices, there is the AWS Mobile SDK. To push Log4J output directly to a stream there is the Apache Log4J Appender Interface. There are also several other community-contributed tools and libraries to choose from. I told you, plenty of options.
And, finally, there is the AWS SDK, which is the closest to the actual API calls, thus being the most flexible and giving you full control over how you write your data. But, of course, with more freedom comes more responsibility. Kinesis API and Node.js SDK (considerations hold for the other languages as well) will be my main focus going forward. So, if you are looking for more information about e.g. Log4J integration, this is not the blog post you’re looking for 🙂 Otherwise, let’s get into some details!
AWS SDK
There are two ways (two distinct API calls) to write data to a Kinesis stream:
putRecordputRecords
As you might have guessed, the first one is for writing individual records, while the second one is for writing records in batches. putRecords supports a batch of up to 500 records or up to 5 MiB.
Here is a simple example demonstrating one of the reasons why you should probably seldom use the putRecord and prefer the batch operation when possible:

Three `putRecord` requests vs a single `putRecords` request with three records
Those are the HTTP requests being sent to AWS when each of the put requests is made. On the left, we write three separate records, while on the right we write the three records in the same request. You can see that the amount of the request overhead is quite considerable. By batching records, we reduce the size and the number of HTTP requests to AWS.
While the size is somewhat easier to demonstrate, the number is probably even more important. For instance, if you have to wait for every single request to complete, a larger amount of requests will increase the latencies of your producer application.
I should mention that from a perspective of stream throughput, there’s no difference whether you batch the records in a single request or send them one by one. Each record is still considered separately and is counted towards the overall shard throughput limits.
As a rule of thumb, if possible, always prefer batch operations. This applies to other AWS services like SQS, DynamoDB, and Kinesis Firehose as well. Of course, yet again, with more perks comes more responsibility, or how did that saying go?
Batch operations
When writing a batch of records to a Kinesis stream, the method call may look something like this:
kinesis.putRecords(params, callback)
where
const params = {
  StreamName: 'someStream',
  Records: [
   {
     Data: 'I want to write this to a stream',
     PartitionKey: 'someKey1'
   },
   {
     Data: 'This is very important, too',
     PartitionKey: 'someKey2'
   }
 ]
}
There is an array of records and a name of the stream you are sending your data to. As I mentioned earlier, each record in the array contains the payload you are sending and a partition key that defines which shard will Kinesis write your record to.
Failures
So, what happens if the HTTP request to the Kinesis API fails, you might ask? And that is an excellent question! If the request fails because of a “retryable” failure (e.g. due to the ServiceUnavailable or other transient 5xx error), AWS SDK retries the request on your behalf up to three times by default. It uses the so-called exponential backoff for the retries, where it starts with a base delay of 100ms by default, after which the time between the consequent retried will increase exponentially.
All these parameters can, and often should be configured. You can do that either when creating an instance of the Kinesis service:
const kinesis = new AWS.Kinesis({
  apiVersion: '2013-12-02',
  maxRetries: 10, // Default: 3
  retryDelayOptions: { base: 200 } // Default: 100 ms
})
or you can set the retry settings for all the AWS API calls by using the AWS Config object:
AWS.config = new AWS.Config({
  maxRetries: 10,
  retryDelayOptions: { base: 200 }
})
Great! So, SDK will take care of the possible failures for us! This means that if we write the following code, we will capture all the failed records, right?
kinesis.putRecords(payload, (err) => {
  if (err) {
    logger.error(`Something bad happened! ${err}`)
 }
})
Wait, not so fast. Remember what I said about great responsibility?
Partial Failures
After a batch request went through successfully (either at once or after the automatic retries), instead of an error, you will get a 200-response that might look similar to the following:
{
  FailedRecordCount: 1,
  Records: [
   {
     SequenceNumber: '12345',
     ShardId: 'shardId-00000'
   },
   {
     ErrorCode: 'ProvisionedThroughputExceededException',
     ErrorMessage: 'Rate exceeded for shard shardId-00001 in stream someStream under account xxx.'
   }
 ]
}
There is an array of records again, though having a different content this time, and an additional attribute called FailedRecordCount. If the value of FailedRecordCount is greater than 0, this means that you had a partial failure of your request. This, in turn, means that part of your records have been written to the stream successfully, while some of them have failed. I guess you could also call it a partial success if you fall on the more optimist side of the spectrum 🙂
That’s the tricky part about all the batch operations in general. They are not atomic (either all fail or all succeed). And if there are partial failures, AWS SDK will treat them as a success and go on with its life (there was the 200-response after all). This means you might be losing your valuable records without even knowing it! You look at your logs, or DLQ (because let’s be fair, logs are not exactly the best way to handle failed records) and all looks bright and sunny. But the reality is, in the meantime, you might actually be losing a lot of your data due to partial failures.
Who’s to blame and what to do?
The main cause for these kinds of failures is exceeding the throughput of a stream or an individual shard. But why does that happen if you have carefully calculated your throughput requirements and provisioned the shards accordingly, you might ask? The most common reasons for that can be really tricky to fix. They are traffic spikes and network latencies. Both of them may cause records to arrive to the stream unevenly and cause sudden spikes in throughput.
To alleviate network latencies for producer applications running inside a VPC, you should always use an interface VPC endpoint for Kinesis Streams. In that way, your requests will never have to leave the VPC, which can potentially significantly reduce the network latencies and other network-related issues.
When it comes to spiky traffic, you could try to implement some form of backpressure in your producer application. But no matter what your network or backpressure setup looks like, the absolutely crucial, highly effective, and luckily also quite straightforward thing to do is to have proper error handling and retries for partial failures.
Let’s see what it may look like in practice and rewrite the putRecords call:
kinesis.putRecords(payload, (err, response) => {
  if (err) {
    logger.error(`Something bad happened! ${err}`)
  } else if (response.FailedRecordCount > 0) {
    retryFailedRecords(payload, response, streamName)
  }
})
Here we check the number of failed records in the batch (the value of FailedRecordCount) and, in case of a partial failure, do the manual retries.
To know which records to retry, we need to use the array of records we got as a response. It contains individual record responses in the exact same order as the outgoing record array. We just need to compare the two arrays and pick the records that have an ErrorCode and ErrorMessage instead of a RecordId.
function retryFailedRecords(payload, response, streamName) {
  _.zipWith(payload.Records, response.Records, (payloadRecord, responseRecord) => {
    if (!responseRecord.ErrorCode) {
      return
    }
    pushToBatchAndSendWhenFull(streamName, payloadRecord)
  })
}
It is important to set an upper limit for the number of retries (similar to AWS SDK, we likely don’t want to be retrying forever) and, for example, send our failed records to a dead letter queue. For that we need to keep track of the retry attempts for each record. One way to do this is to add the retry count to the data we send to our stream.
So our retryFailedRecords function may end up looking similar to this:
function retryFailedRecords(payload, response, streamName) {
  _.zipWith(payload.Records, response.Records, (payloadRecord, responseRecord) => {
    if (!responseRecord.ErrorCode) {
     return
    }

    const data = JSON.parse(payloadRecord.Data)
    const retryCount = data.kinesisRetryCount
    if (retryCount < MAX_RETRIES) {
      data.kinesisRetryCount += 1
      pushToBatchAndSendWhenFull(streamName, kinesisRecord(data, payloadRecord.PartitionKey))
    } else if (retryCount >= MAX_RETRIES) {
      sendToDLQ(streamName, retryCount)
    }
  })
}
Retries & Jitter
Now, when it comes to retrying, we would want to use a similar exponential back-off approach to the SDK’s automatic retries. After all, we don’t want to keep bombarding a stream or a shard that is probably already overwhelmed with more and more requests. So, let’s iterate on our sample code one more time:
function retryFailedRecords(payload, response, streamName) {
  _.zipWith(payload.Records, response.Records, (payloadRecord, responseRecord) => {
    if (!responseRecord.ErrorCode) {
     return
    }
    const data = JSON.parse(payloadRecord.Data)
    const retryCount = data.kinesisRetryCount
    if (retryCount < MAX_RETRIES) {
      data.kinesisRetryCount += 1
      setTimeout(() => {
        pushToBatchAndSendWhenFull(streamName, kinesisRecord(data, payloadRecord.PartitionKey))
      }, delay(retryCount))
    } else if (retryCount >= MAX_RETRIES) {
      sendToDLQ(streamName, retryCount)
    }
  })
}

function delay(attempt) {
  return RETRY_BASE_DELAY * (2 ** attempt)
}
That is already pretty good, compared to where we started, right? However, we can do even better than that! To avoid sending bursts of retries, we should add a random jitter to the delay. In that way, we will spread the retry attempts more uniformly and significantly decrease the risk of overwhelming the stream. This is what our delay function might look like:
function delay(attempt) {
  const exponentialDelay = RETRY_BASE_DELAY * (2 ** attempt)
  return Math.floor(Math.random() * (exponentialDelay - RETRY_BASE_DELAY)) + RETRY_BASE_DELAY
}
And we are done! We have built a simple, yet effective retry strategy to handle partial failures.
There is an excellent article about retries and timeouts in the Amazon Builders’ Library that I would strongly encourage you to read. This is incredibly helpful because it is not specific to any particular service, but rather to the nature of distributed systems.
And speaking of timeouts…
Timeouts
Any remote call can timeout. This can happen due to a multitude of reasons, such as network glitches, service being busy, or the response being lost on its way to you in the vast space of the Internet. This happens all the time and this happens to AWS API calls as well. That’s why AWS SDK has a default value set for request timeouts. After the timeout is reached, a request will fail and will be retried automatically, like any other retriable failed request.
Each SDK has its own ways of configuring the request timeouts. Node.js SDK allows you to set two distinct types of timeous:
connectTimeout: a timeout on establishing a new connection for a socket; if not explicitly set, this value will default to the value of thetimeouttimeout: read timeout for an existing socket, or, in other words, the time between when the request ends and the response is received, including service and network round-trips
It’s important to understand the differences between the two. It’s equally important to know what the default values are and to configure the timeout values according to the expected latencies of the services you are using.
In the case of Kinesis API, the default timeout for an existing socket (the timeout configuration) is 2 minutes. This means that, by default, AWS SDK will wait for the response for the entire two minutes, before it gives up and retries the request. Add to that the default 2 minutes for establishing a new connection and possible retries that follow both of the timeouts, and you get a producer that is stuck for a while waiting for something that might never happen.
So, it’s usually a good idea to configure the timeouts to be considerably shorter than the default values. Similarly to the retry configurations, this can be done by setting the HTTP request timeouts for either all the AWS Services using the Config object:
AWS.config = new AWS.Config({
  httpOptions: { connectTimeout: 1000, timeout: 1000 },
})
or for the Kinesis Streams itself:
const kinesis = new AWS.Kinesis({
  apiVersion: '2013-12-02',
  httpOptions: { connectTimeout: 1000, timeout: 1000 }
})
The timeout configurations, along with the configurations related to the retry behavior, are extremely useful knobs that you can use to control the behavior of your producer in case of a failure.
‘At least once’ guarantee
There is one more thing to mention, that is implicitly related to request failures and retries. Though the records are guaranteed to be ordered within a shard and each record will end up in exactly one shard (thanks to the partition keys), Kinesis Streams does not provide the “exactly once” guarantee. This means that you will have duplicate records in a shard every now and then.
One of the reasons for this is the network timeouts and retries we discussed above. For instance, a request to write a record might actually go through but the response never gets back to the producer, so the request times out and the same record is being written again with a retry. And now we have two records with identical data. Also, there are various reasons why a consumer might consume the same record multiple times.
This is also a common consideration in distributed systems and the best way to address it is to build your downstream applications to be idempotent. That is, to build an application that will tolerate the possible duplicates in data.
A few words on KPL
I mentioned in the beginning that you could write your data to Kinesis Streams using Kinesis Producer Library, or KPL in short. While AWS SDK also allows managing the stream itself (e.g. do stream resharding), KPL is meant solely for writing data to a stream and is aimed to simplify it.
To be precise, KPL is not just a library but also a C++ daemon that you need to install, and that runs when you are using the KPL. It allows KPL to take care of several aspects of writing data to the stream on your behalf, including the handling of partial failures. In addition to several other useful features, it makes interacting with Kinesis API asynchronous, while KPL daemon abstracts the synchronous calls away from you. You can read this article for a pretty detailed explanation of how KPL works, as well as its pros and cons.
One of the benefits of KPL is record aggregation. It is an additional way of batching records (vs record collection achieved by the PutRecords). Remember I said that using PutRecords doesn’t affect the shard limits of 1000 records/sec or 1MB/sec? If you are writing a large amount of small records to your stream, you will reach the 1000 record/second limit long before the 1MB/second limit. This means that you are underutilizing your shards and thus, paying extra. The intuitive way to solve this issue is to combine several of your data records in a single Kinesis record before sending it to the stream. KPL implements just that on your behalf. Of course, when reading the aggregated data from the stream, the consumer must be able to recognize and de-aggregate it. Here’s where the Kinesis Consumer Library (KCL) steps in. It automatically recognizes aggregated records and does all the “magic” of de-aggregation on your behalf.
KPL vs AWS SDK?
KPL is another level of abstraction over API calls. Though simplifying certain aspects of writing to a stream, in my opinion, KPL can add an often unnecessary layer of complexity and comes with its own limitations you should be aware of when using it. With SDK you also avoid having an extra moving part in your application (the KPL daemon). You have full control over how you write your data. As we have discussed, you also have a greater responsibility, but, in most cases, just the few simple guidelines we discussed will be sufficient to let you sleep at night.
Moreover, unlike KPL, most AWS SDK considerations apply across many other AWS services, instead of being just Kinesis Streams specific. Thus understanding those aspects is probably a good idea if you are planning to interact with more AWS services.
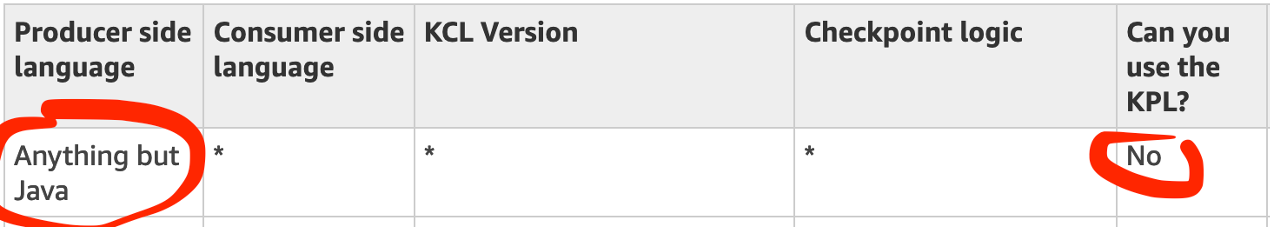
Finally, while there are several pros and cons to consider and argue about when choosing between AWS SDK and KPL, there is one that is the big pink elephant in the room. While KCL does have support in several languages, KPL is only supported in Java
Bonus: Kinesis Data Generator
There is one more way to write data to a stream I wanted to mention. It is often useful to simulate data being written to the stream, e.g. to test consumer’s behavior. To simplify this process, there is a tool called Kinesis Data Generator (KDG). You can find it in GitHub or use the hosted UI here. There is also an extensive blog post on using KDG.
Monitoring a stream
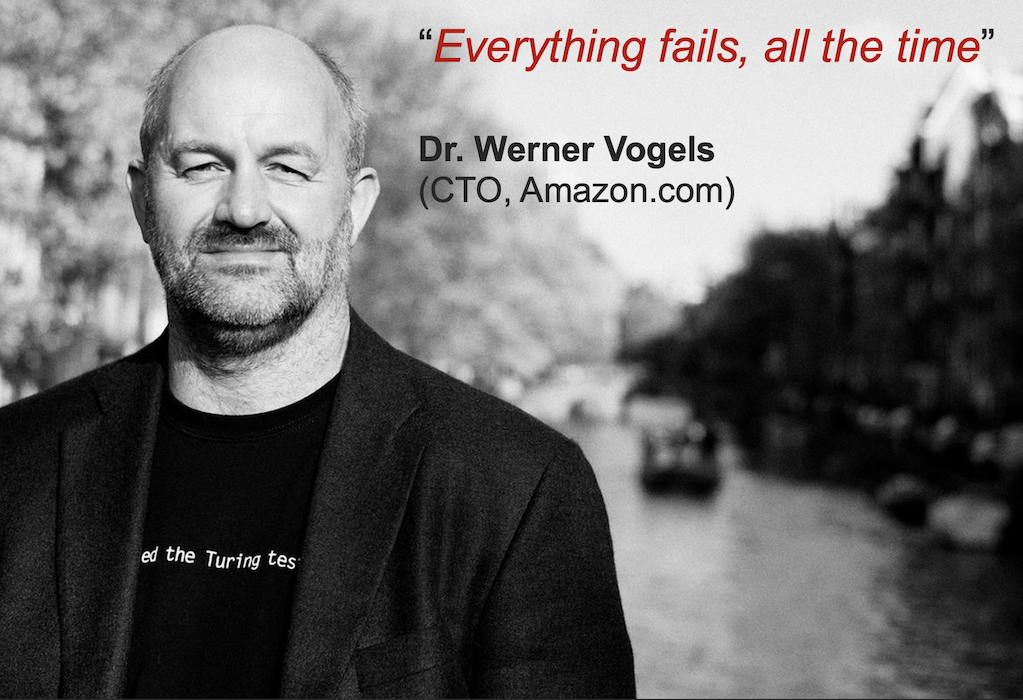
Now when we have been talking about failures for quite some time (because everything fails, all the time, right? 🙂), it’s time to talk about how you can detect failures and monitor your stream’s performance. CloudWatch has a set of metrics related to Kinesis Streams.
The so-called “basic” metrics are enabled by default and tell you about the stream in overall. You can also enable the “enhanced” metrics, which allow you to monitor the stream on the level of individual shards. The enhanced shard-level metrics can be very useful, especially when you suspect having an “overheated” shard, but they will cost you extra. The basic stream-level metrics are free.
Below are the most important metrics to keep an eye on when writing to a Kinesis stream:
-
IncomingRecords: The number of records successfully written to the Kinesis stream. This includes records from bothPutRecordandPutRecodsoperations. In case you want to separate the two, each of them has its own metric as well:PutRecord.SuccessandPutRecords.SuccessfulRecordsrespectively. -
IncomingBytes: This, in turn, shows the size of data successfully written to the Kinesis stream. Once again, it’s a combined metric includingPutRecordandPutRecordsoperations (PutRecord.BytesandPutRecords.Byteswill tell you about the individual operations).
Note that these metrics do not include the failed record writes. So, you can’t know the exact overall amount or size of incoming data based on these metrics alone, but you will get quite close. There is one more metric that is crucial to get the overall picture of your stream’s wellbeing:
WriteProvisionedThroughputExceeded: The number of records rejected due to throttling for both,PutRecordandPutRecordscombined. There is also a separate metric for the partial failures in batch operations:PutRecords.ThrottledRecords.
Note: as of March 2021, there are some known issues with the combination metric and it is recommended to use theWriteProvisionedThroughputExceededonly in case you write individual records withPutRecordoperation. If you are using the batchPutRecordsoperation, use the dedicatedPutRecords.ThrottledRecordsinstead.
So, to get the actual number of records that you attempted to write to your Kinesis stream, you should add the IncomingRecords to the WriteProvisionedThroughputExceeded (or PutRecords.ThrottledRecords). Note that these metrics also include all the retry attempts.
Metrics vs reality
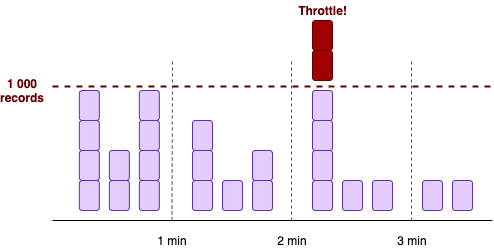
All the Kinesis Streams metrics, both basic and enhanced, are emitted once a minute. This means that the most granular information you can get about your stream is on the level of one minute. For example, use the Sum statistics of the IncomingBytes over one minute to get an idea of your stream’s throughput in a minute.
There’s a catch though: as I mentioned before, all the kinesis limits are per second (1Mb/second or 1000 records/second per shard). So, when you have spiky traffic, the metrics won’t reflect the entire picture. As we know by now, you may exceed stream throughput even if the stream capacity limits seem far away based on metrics.
So, pay close attention to the WriteProvisionedThroughputExceeded and PutRecords.ThrottledRecords metrics at all times. Also, if enabled, check the shard-level metrics, to make sure you don’t have overheated shards that may cause throttling.
Pricing model
There’s one more important thing to discuss before we can wrap up the first part of this saga, and it’s about the money.
You can find a detailed description of how the costs of a Kinesis stream are calculated here. As I mentioned before, once you create a stream, you start paying for the amount of data being streamed, as well as for the number of open shards in the stream.
There are also several other aspects to keep in mind when it comes to calculating the overall cost of a Kinesis stream. In addition to the basic costs associated with a Kinesis stream, you will pay for the following:
- having data retention over 24 h: if you actually need to store the data for some extra time, you will have to pay for it. For the first extra 6 days, the pricing is per shard per hour. This is called extended data retention. After the data has been in the stream for 7 days (24 hours + 6 days of the extended data retention), the long-term retention kicks in and you start to pay for the amount of data stored in the stream per month.
- enhanced (shard-level) CloudWatch metrics: the pricing is the same as for having custom metrics and you pay per shard per metric per month. Though the price of CloudWatch metrics is quite modest compared to the other Kinesis costs, if you just blindly enable all the available shard-level metrics (there are 7 of them) for each stream you have, those costs can start to accumulate pretty quickly.
And then there are some possible extra costs associated with consuming the data:
- using enhanced fan-out
- DynamoDB charges when using KCL
I will just leave those here for now. Let’s get back to them in Part 2 when we discuss consuming data from a Kinesis stream.
Conclusions
There seems to be a common misconception that serverless and fully managed mean that the services never fail. But, as we know, everything fails and we should always have a failure in mind when developing our systems. Not to be pessimistic, but to be prepared.
Here are some of the key takeaways I hope you find useful. The bonus here is that many of them apply to most of the API calls done through AWS SDK (think of SQS, DynamoDB, Kinesis Firehose, etc.)
Batch operations and partial failures:
When using batch operations, such as the PutRecords API for Kinesis Streams (and let’s face it, it will be most of the time, unless you have a solid reason not to), always allow for partial failures. They will happen. To be frank, if you haven’t addressed them yet, they are probably happening right now and you might have no idea. And trust me, it’s an awkward moment when you realize that. But the moment is better to come sooner rather than later 🙂
Retries with backoff and jitter:
And speaking of failures, make sure your retry algorithm uses some form of a backoff (exponential happens to be the most popular one) and some random jitter. I can’t emphasize this enough. USE JITTER! Ok, maybe that’s enough now 🙂 I literally saw a drop of partial failures after all the retry attempts from several thousand to a steady 0 by just implementing this simple strategy.
Connection timeouts:
Be ready for services and API calls to time out. Don’t fall back on the default HTTP timeout values, but rather set them yourself. In the case of Node.js, remember to set both, the timeout and the connectTimeout.
Network latencies:
If your producer application is running inside a VPC, always use an interface VPC endpoint for Kinesis Data Streams, to potentially significantly reduce the network latencies and other network-related headaches.
Important metrics:
The most valuable metrics when writing to a stream:
IncomingRecords/IncomingBytesWriteProvisionThroughputExceeded/PutRecords.ThrottledRecords
Remember, that CloudWatch metrics are per minute, while the stream limits are per second (1 MB/sec or 1 000 records/sec per shard). And though very important, just looking at the metrics is not enough. You must have proper error handling (am I repeating myself? 🙂).
And finally,
Pricing:
Keep in mind, that in addition to the “baseline” fees of incoming data and open shards, Kinesis Streams can cost you extra:
- having data retention over 24 h (pricing is per shard per hour at first, and per GB per month after the day 7)
- Enhanced (shard-level) CloudWatch metrics (per shard per metric per month)
- using enhanced fan-out
- DynamoDB charges when using KCL
And that’s it, my friends! If you managed to read this till the end, you should have a solid idea of how Kinesis Streams work and how you can write data to a stream, avoiding some of the most common pitfalls. In Part 2, I’ll be talking about reading from a stream, in particular using AWS Lambda as a stream consumer.
Let me know if you think I’ve missed something critical and hope to see you in Part 2 🙂