The coordinate systems are probably one of the most confusing areas of the GIS systems. What are the coordinate systems and how should I take them in account on my development work? In this post I will cover some basic principles related to this area.
First, definitions of the terms:
- A coordinate system is a method for identifying the location of a point on the earth. Most coordinate systems use two numbers (= a coordinate) to identify the location of a point. Wikipedia
- A map projection is a method for taking the curved surface of the earth and displaying it on something flat, like a computer screen or a piece of paper. This mathematical transformation is commonly referred to as a map projection. Wikipedia
- WebMercator is a popular map projection that covers the whole world. Wikipedia
- ETRS-TM35FIN is a national map projection that covers the Finland country area. Wikipedia
In the other words, coordinate systems are required to give a numerical value for a geographic location on the earth surface. Projections are required to present a round 3D ball as a flat 2D plane.
We can remember from the school mathematic lessons that representing the ball on the plate is not an easy issue to solve, and job can be archived by multiple different ways. It is not surprising that during the decades tens of coordinate systems and projections have been introduced. It seems that every map maker has been different kind of the vision about the our world :) Some popular coordinate systems and projections are for example, WebMercator, WGS84 and ETRS-TM35FIN.

WebMercator projection
In a modern web mapping solution the most popular projection is so called WebMercator projection. The WebMercator is used by the every major mapping provider such as Google Maps, Bing, Here etc. The WebMercator is based to the Mercator projection, that was presented by Gerardus Mercator in 1569. At 2005 Google introduced its own Mercator variant named by the WebMercator that rapidly become de facto standard of the modern mapping solutions.
I think that the practical reason for popularity of the WebMercator is the fact that it is capable to cover the whole world in a reasonable format, it looks nice for eye and works well on the web and the digital devices. On the other hand, known problem of the WebMercator is its heavy distortion of the north and the south areas of the world. Equator is represented as a natural dimensions but distances start to stretch when traveling to south and north. For example, Greenland seems to be almost same since as Africa. In reality, the Greenland is about 1/14 size.
People have argued about the popularity of the WebMercator projection. Maybe one reason is geopolitical, since the WebMercator presents industrialized countries such as US and Europe unrealistically large related to Africa and other equator countries.

Geodesic distances, lines and great circles
One of the key things to take into account, when developing map applications, is distortion that is affected by various map projections. Distortion is result of the calculation where the round 3D ball is projected into the 2D plane. For example, when looking the WebMercator map, it seems that the direct route between Helsinki and Los Angeles goes over the Atlantic ocean. In a real world, the shortest route on the earth surface goes over the Greenland. The shortest route is called by geodesic distance. When drawing lines and circles on the earth surface we are talking about Geodesic lines and Great circles.
So, when I should worry about geodesic distortion? It depend on quite a lot about the requirements. Distortion should be taken into account when it is required to draw lines and areas to the earth surface or make a GIS analysis. Distortion begins to appear when the distance is longer than few kilometers - let’s say that areas bigger than cities.
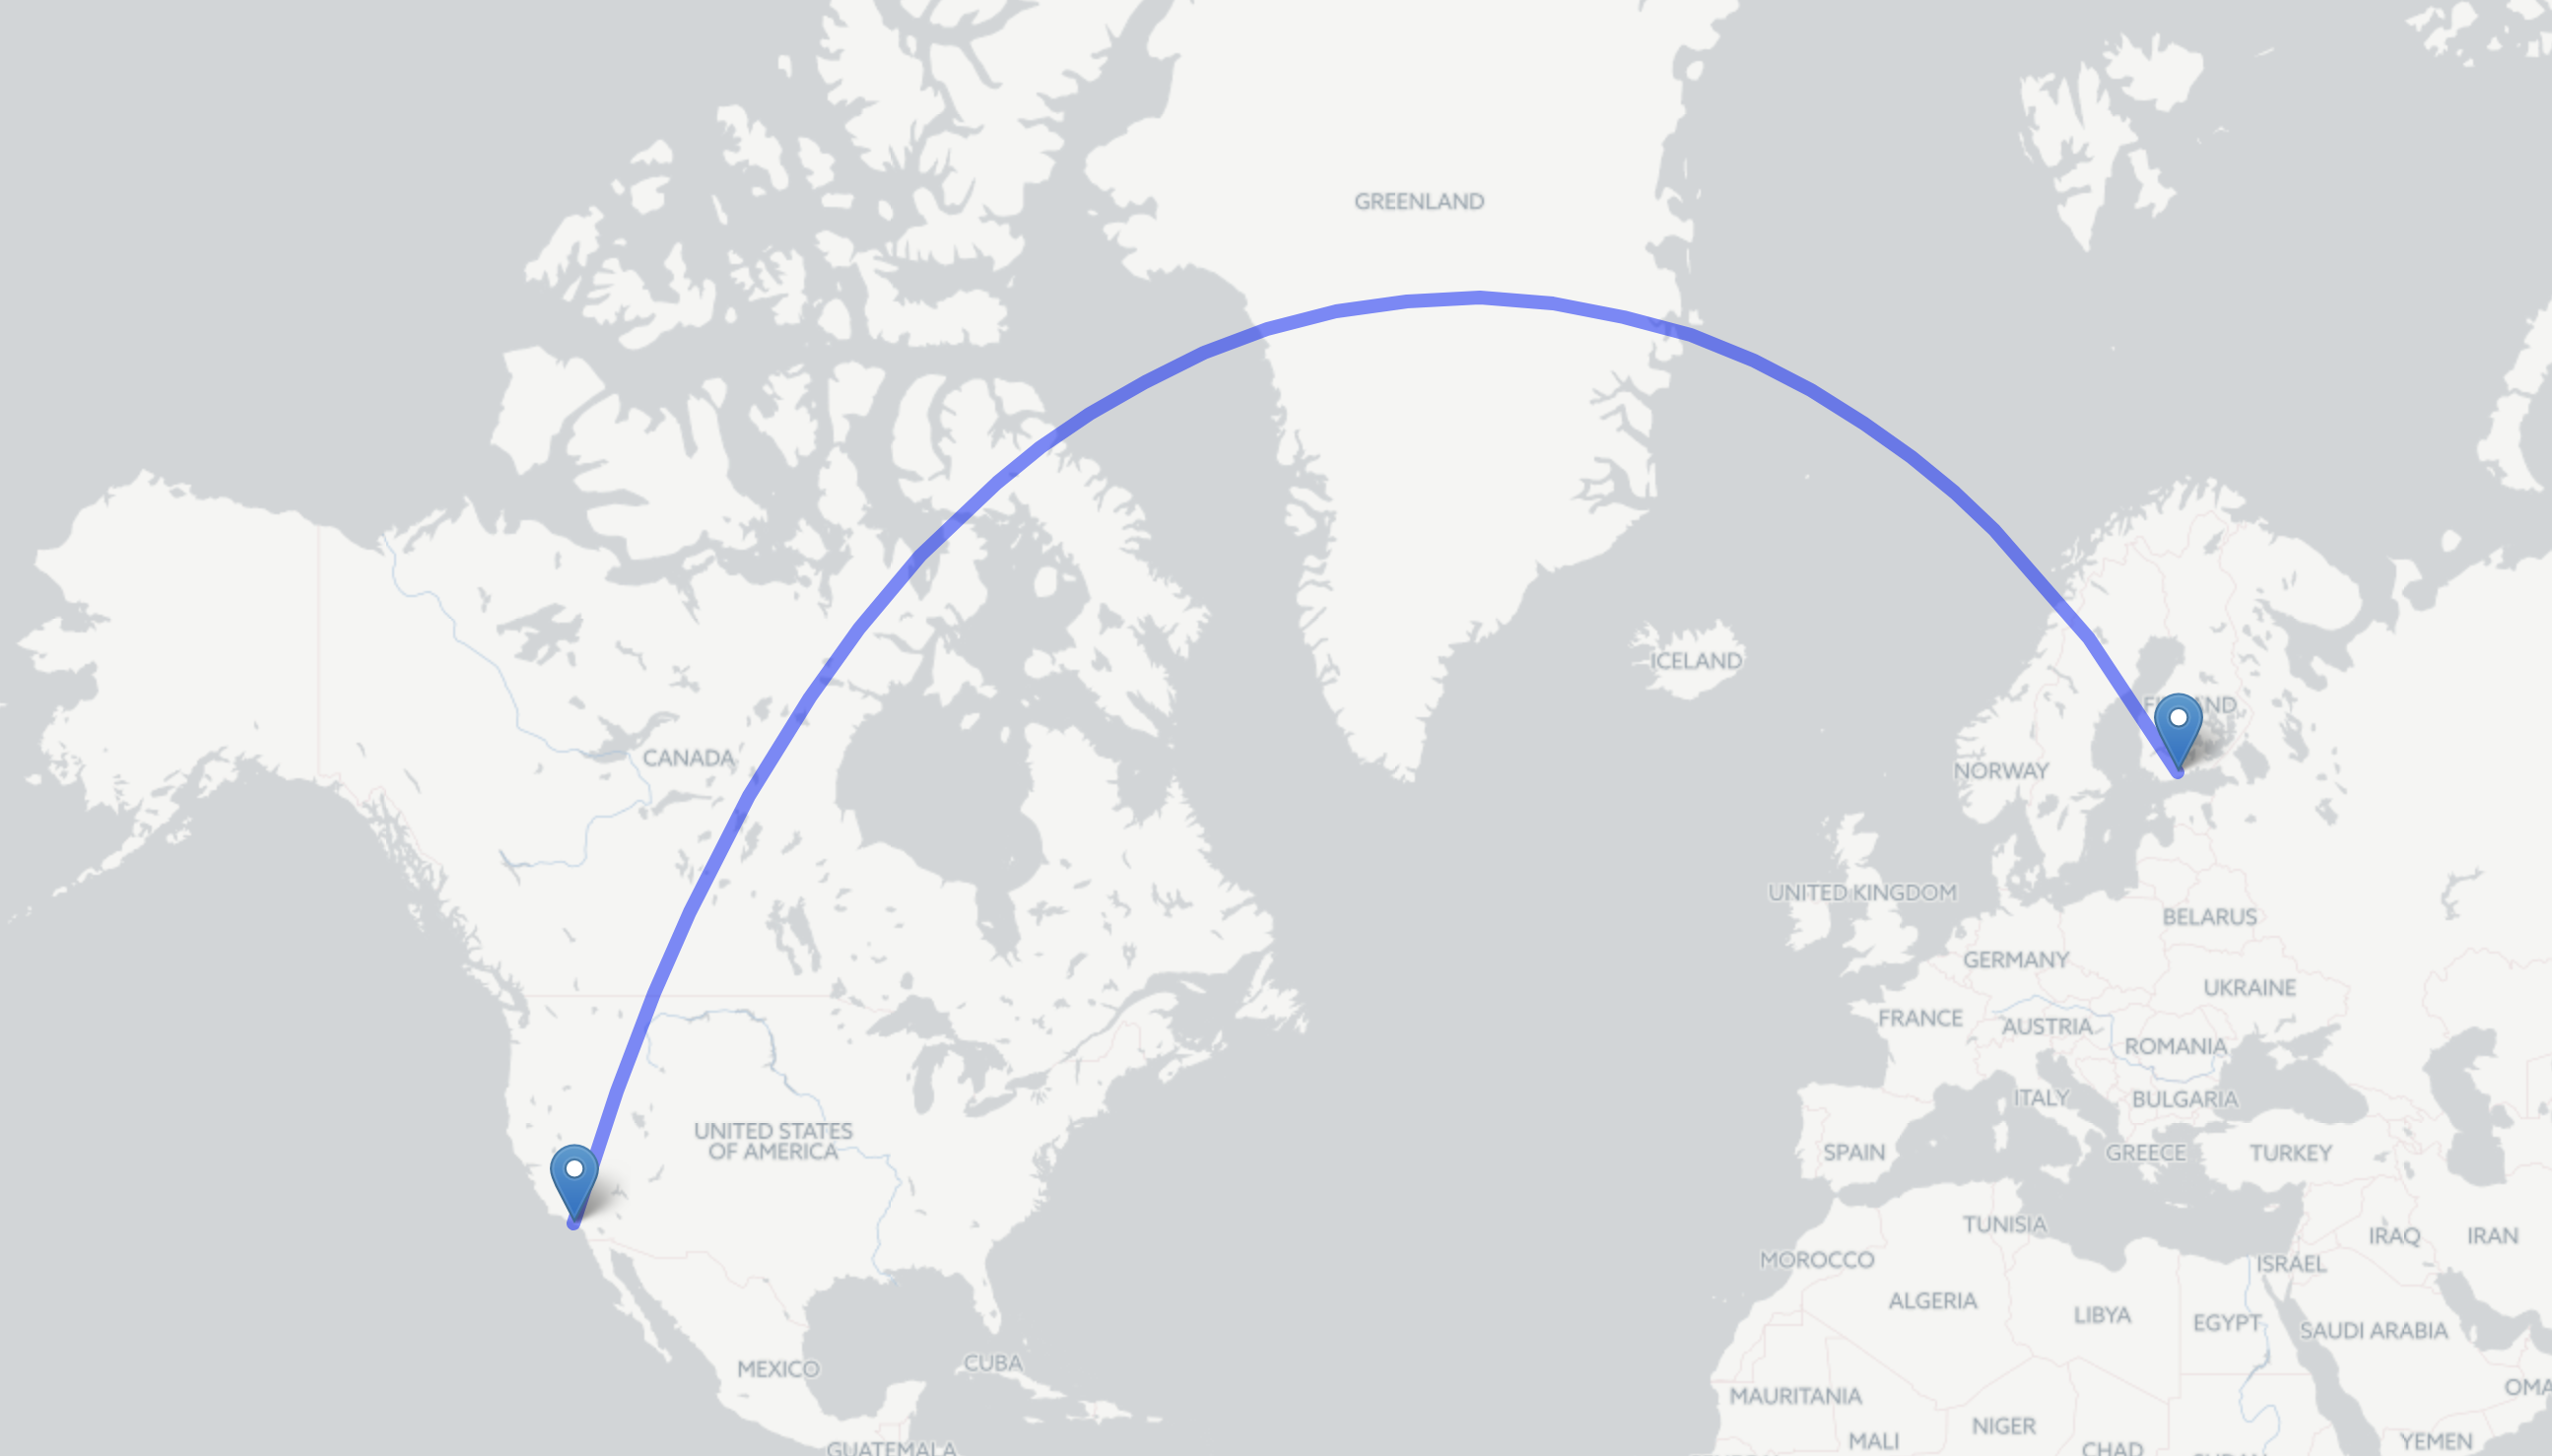
The picture above presents the shortest distance from Helsinki to California on the WebMercator map. As we can see, it is not a straight line - it is a geodesic line. Geodesic lines can be drawn for example by the web map APIs. Google maps and ArcGIS APIs does it out of the box. Leaflet requires a plugin component. This picture is drawn by the Leaflet with the plugin Leaflet.Geodesic.
 Distortion over the Finland. The orange filled rectangle is planar and the curved lines are geodesic. This picture is drawn by QGIS.
Finnish coordinate systems
From national point of view the WebMercator is problematic. The WebMercator is designed to present the whole world at once and for that reason pole areas are distorted. Solution to prevent the distortion is national coordinate systems. In Finland the most common is the ETRS-TM35FIN that is designed to present only the Finland area in correct dimensions. Difference between the coordinate systems are obvious when comparing images side by side. The ETRS-TM35FIN presents the Finland in a natural dimensions when the WebMercator stretch the norther part of the country.
 The ETRS-TM35FIN center meridian is 27°E.
The ETRS-TM35FIN is also some sort of a compromise. It covers relative wide area so it is not completely accurate in every part of Finland. For the fully accurate calculations there are other national systems covering only the small areas. Typically municipalities has they own systems and for example, Helsinki has a system named by ETRS-GK25. The ETRS-GKn coordinate systems are narrow slides covering the whole Finland from west to east.
Latitudes and Longitudes WGS84
Usually locations are presented as Lat and Lon numbers, which are so called geographical coordinates. The geographical coordinates are used to present a location on the earth’s surface as a numeric value. Typically they are degree angles from the equator and the world center meridians. Every place on the earth’s surface has a numeric coordinate. The one popular geographical coordinate system is World Geodetic System 84 (WGS 84) that is used for example by the GPS system.

The LatLon coordinates can be presented as a different formats. Let’s take a look the coordinates of Helsinki:
DD Latitude: 60.192059 DD Longitude: 24.945831 DMS Lat: 60° 11’ 31.4124’’ N DMS Long: 24° 56’ 44.9916’’ E
DD means Decimal Degrees and DMS means Decimal Minutes Seconds. DD and DMS are equal but they need conversion. Conversion is typically handled by the API functions and there is no need to worry about the calculation formulas.
Just in case: Decimal Degrees = Degrees + (Minutes/60) + (Seconds/3600)
The WebMercator projected coordinate for Helsinki is: 2775752, 8435259.
Gridded systems
In addition, there are gridded coordinate systems those divide the world into zones and grids. Gridded systems are for example, Universal Transverse Mercator (UTM), United States National Grid (USNG), Military Grid Reference System (MGRS).

Tips for developers
Coordinate systems and basemaps
- The WebMercator is safe to use, it works well in most of the applications and APIs. Just remember the distortion!
- The WGS84 Lat Lons are well supported by the map APIs and there are no issues to use those. Key thing is to select correct formatting for the representation.
- The ETRS-TM35FIN basemap gives more professional look for the map compared to the WebMercator since Finland is represented as natural dimensions. For example, Maanmittauslaitos provides popular and high detail Finnish basemap called by “Taustakartta”. Practically the national basemap is required since it is heavy process to project the global bitmap basemaps to the national coordinate system on the fly.
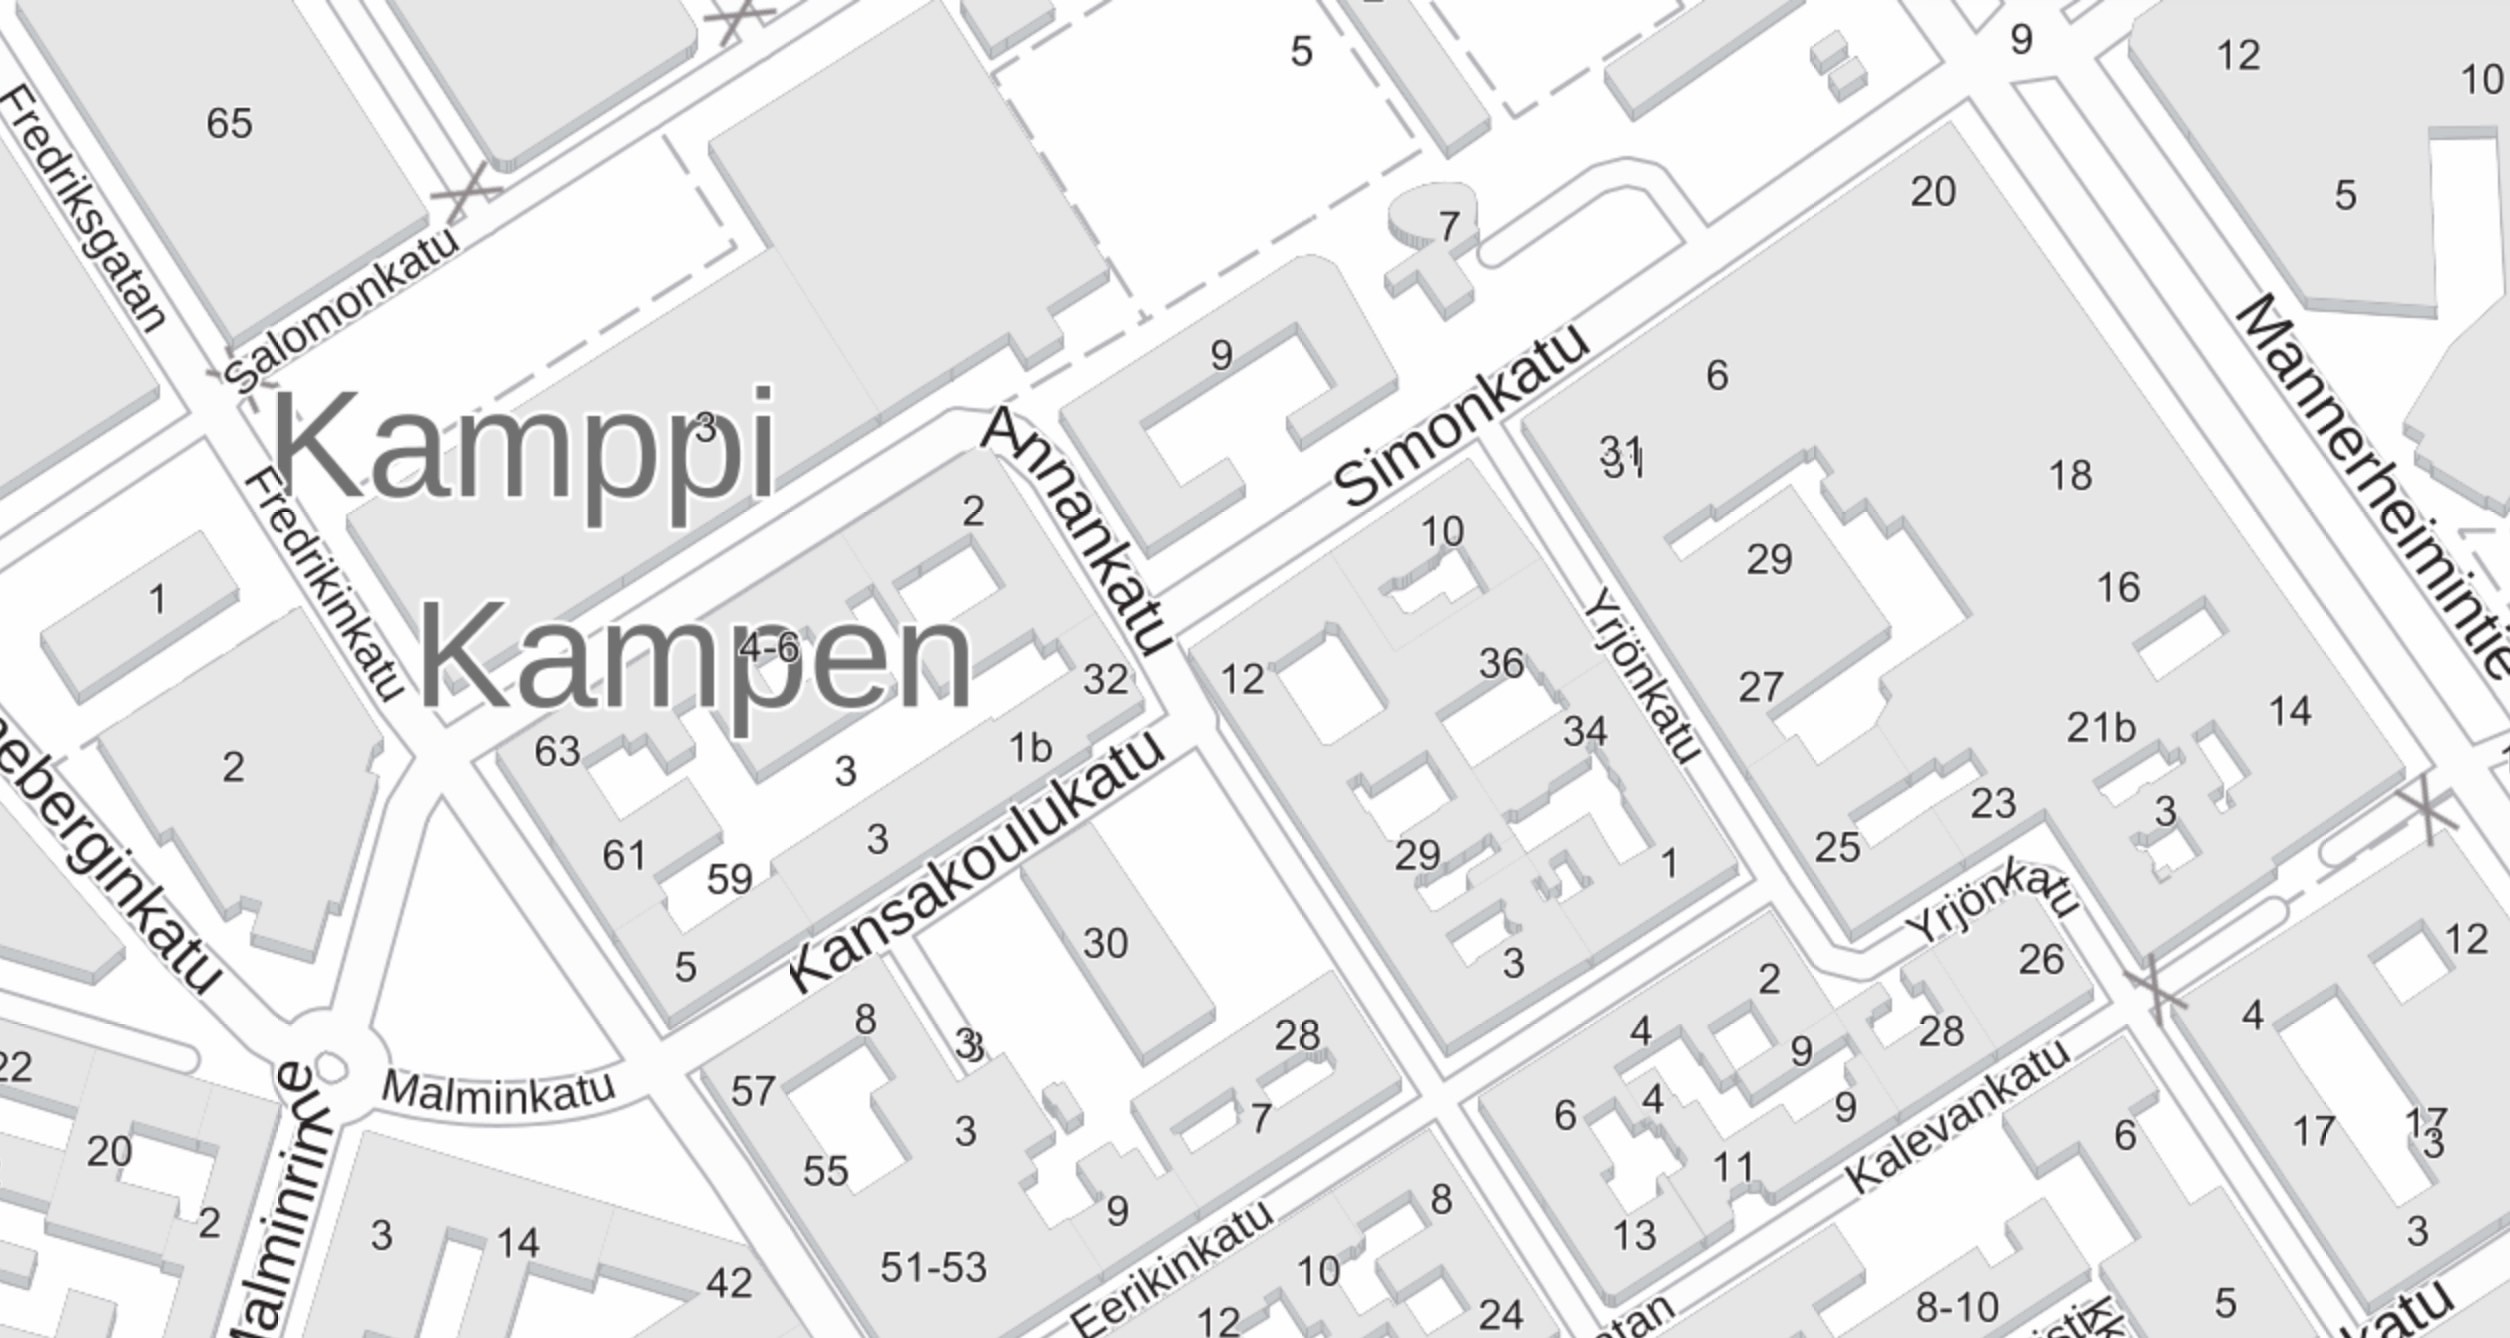 Taustakartta Maanmittauslaitos
The example below presents how to use the Finnish basemap on the Leaflet. This example uses Proj4Leaflet library and the basemap is offered by Kapsi.
var InitialCoord = {lat: 60.171944, lng: 24.941389};
function getCRStm35() {
var bounds, crsName, crsOpts, originNw, projDef, zoomLevels;
zoomLevels = [8192, 4096, 2048, 1024, 512, 256, 128, 64, 32, 16, 8, 4, 2, 1, 0.5, 0.25];
crsName = 'EPSG:3067';
projDef = '+proj=utm +zone=35 +ellps=GRS80 +towgs84=0,0,0,0,0,0,0 +units=m +no_defs';
bounds = L.bounds(L.point(-548576, 6291456), L.point(1548576, 8388608));
originNw = L.point(bounds.min.x, bounds.max.y);
crsOpts = {
resolutions: zoomLevels,
bounds: bounds,
transformation: new L.Transformation(1, -originNw.x, -1, originNw.y)
};
return new L.Proj.CRS(crsName, projDef, crsOpts);
}
function createTileLayer(name) {
return L.tileLayer("https://{s}.kapsi.fi/mapcache/" + name + "/{z}/{x}/{y}.png", {
attribution: '© Karttamateriaali <a href="http://www.maanmittauslaitos.fi/avoindata">Maanmittauslaitos</a>',
continuousWorld: true,
tms: 'tms',
maxZoom: 8192,
minZoom: 1,
subdomains: ['tile1','tile2']
});
}
function makeMap(elem, defaultBasemap) {
var map;
var defaultOpts = {
center: [InitialCoord.lat, InitialCoord.lng],
}
opts = defaultOpts;
opts.crs = getCRStm35();
opts.zoom = 6;
opts.layers = defaultBasemap
map = L.map(elem, opts);
return map;
}
var taustakartta = createTileLayer("taustakartta_3067");
var map = makeMap("mapid", taustakartta);
Coordinate conversions
- JavaScript web map APIs typically defines the dataframe coordinate system from the basemap’s coordinate system. If the WebMercator basemap is selected then the all upper layers (WMS etc.) must be also in the WebMercator. Typically this is not an issue when using GIS servers. For example the ArcGIS Server provides data almost in any coordinate system. Just give the coordinate system ID as an attribute. GeoServer WMS layers may have some limitations based to the WMS service settings.
- Note that the coordinate conversion will always cost CPU resources, so try to avoid it. Optimal solution is to store and present geospatial data in a same coordinate system.
- If the requirement is to draw simple geometries (for example by GeoJSON), it is no need to worry about the projections too much. Just choose the basemap - map API should take care about the projections.
Geodatabases
- Postgis geodatabase contains two geometry datatypes: Geography and Geometry. Please note that the Geography handles geodesic calculation but the Geometry uses a planar geometry. The Geography should be always used when calculating long distances and handling large areas.
Coordinate system codes
- WebMercator: EPSG:3857 ESRI:102100
- ETRS-TM35FIN (EUREF-FIN, ETRS89): EPSG:3067, ESRI:102139
(Image sources are found from the image alt text.)